USER STORY
From First Scan to Real Insights: Learning Digital Building Surveys with Laser Scanning

Contens
An entire building ensemble as a testing ground
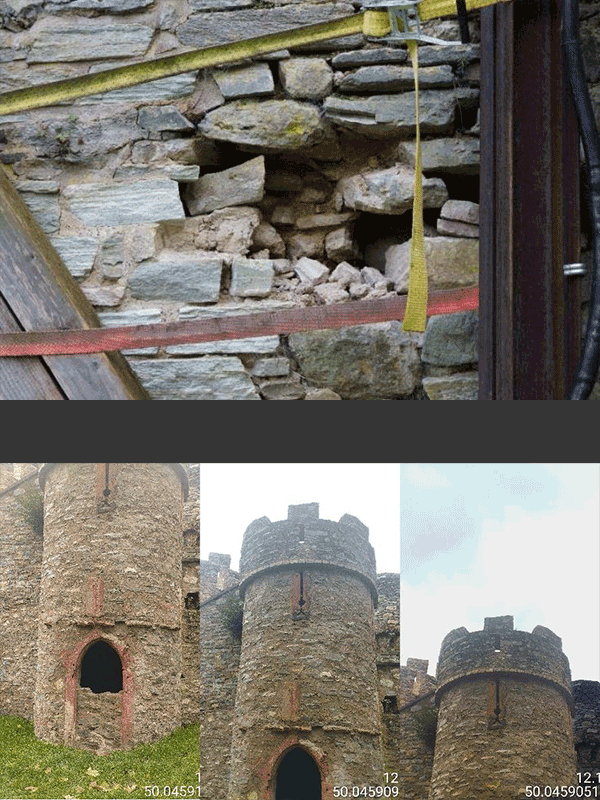
A watchtower as a learning object
The first step matters: planning the scan on site
When theory meets reality
Working with the point cloud: from export to drawing
Data management and sharing
Between expectations and reality: a steep learning curve
Conclusion: technology meets learning
Our recommendation for getting started
Project participants
What happens when architecture students work with terrestrial laser scanning for the first time? That was exactly the focus of the Building Surveying course at Koblenz University of Applied Sciences: moving away from traditional tape-measure methods and toward a digital understanding of existing buildings.
The result is not a polished showcase, but an honest look at a learning process – one that highlights both the potential and the complexity of scan-to-CAD workflows.
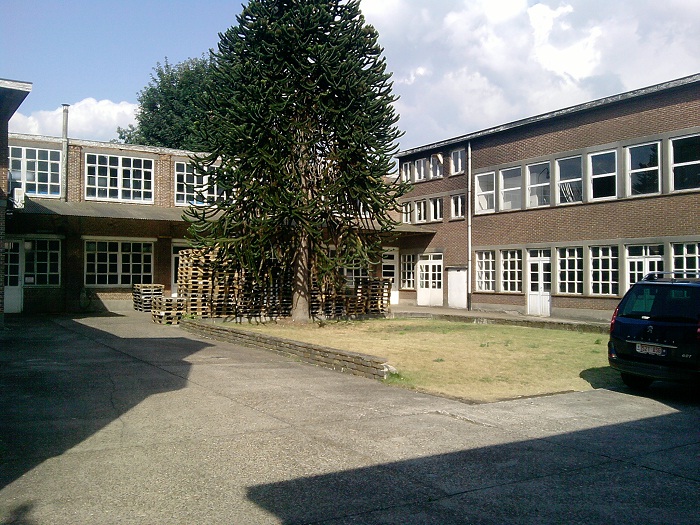
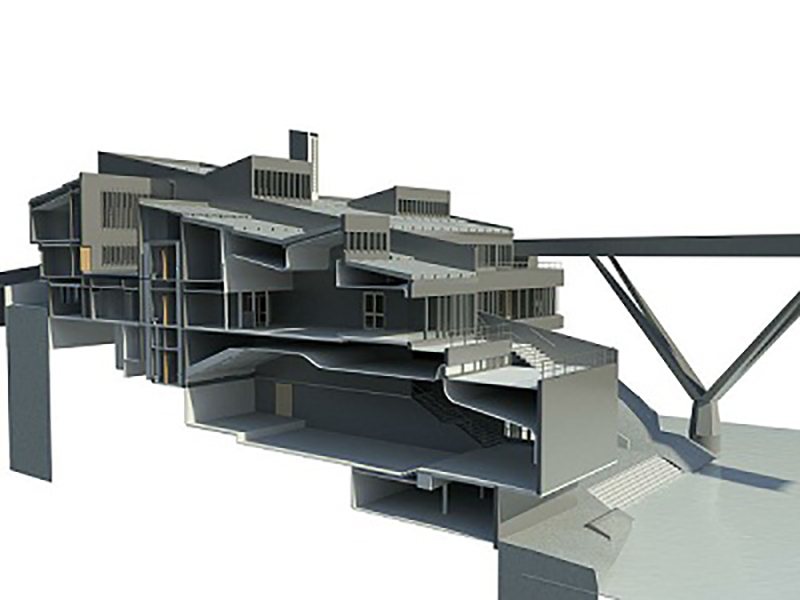
An entire building ensemble as a testing ground
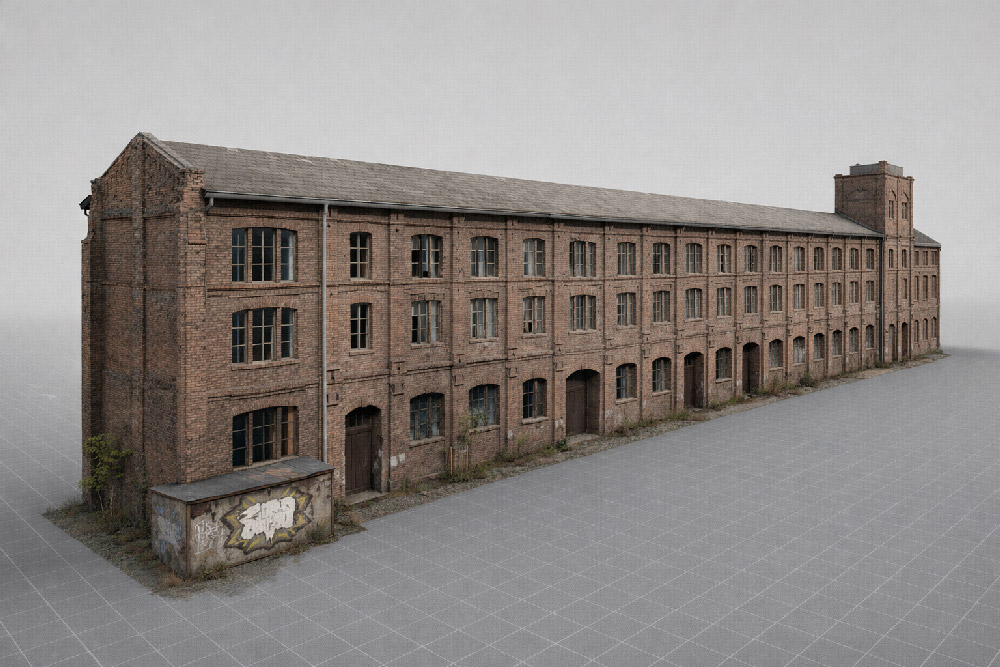
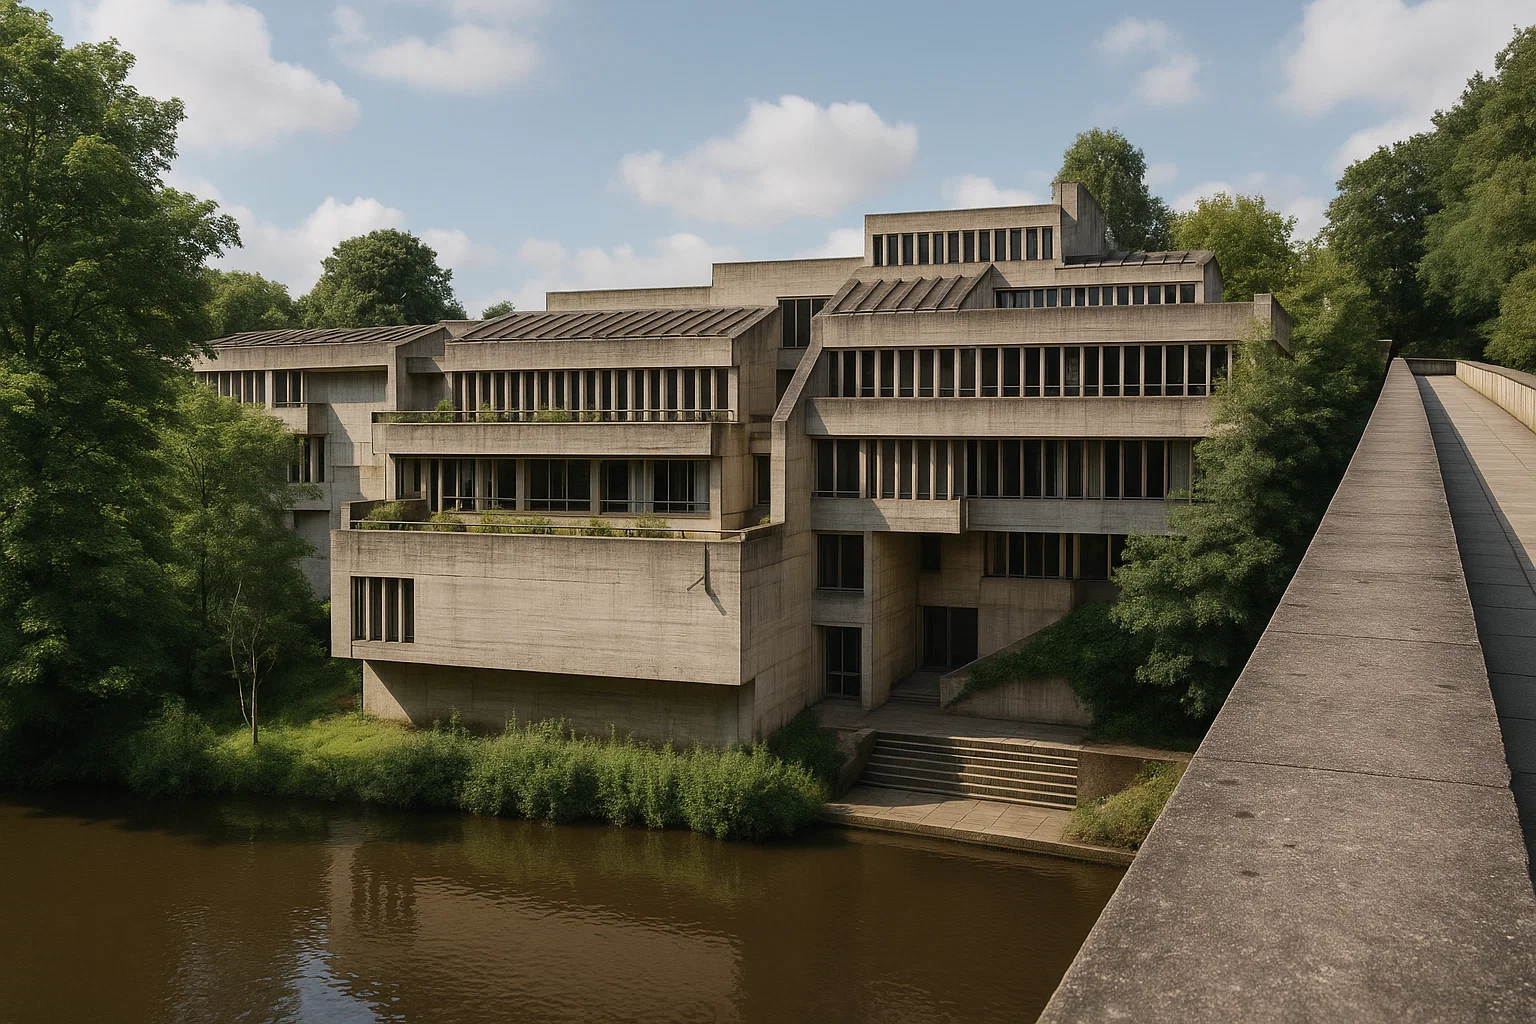
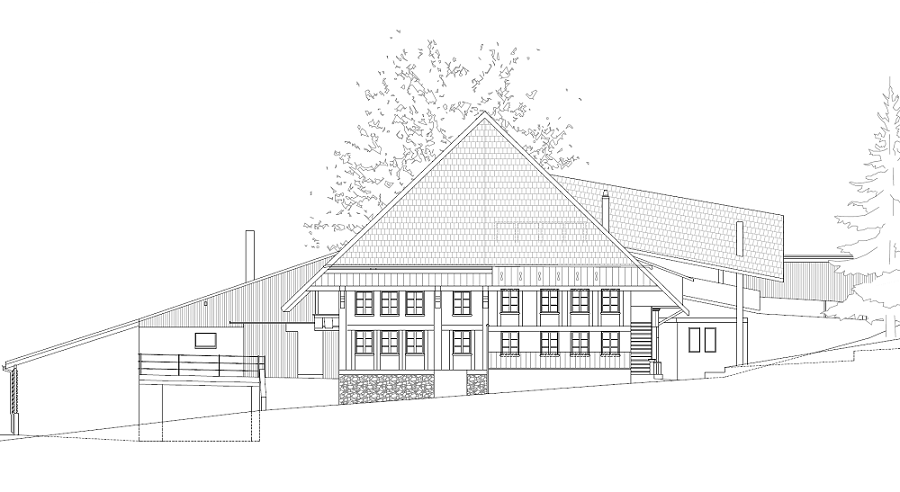
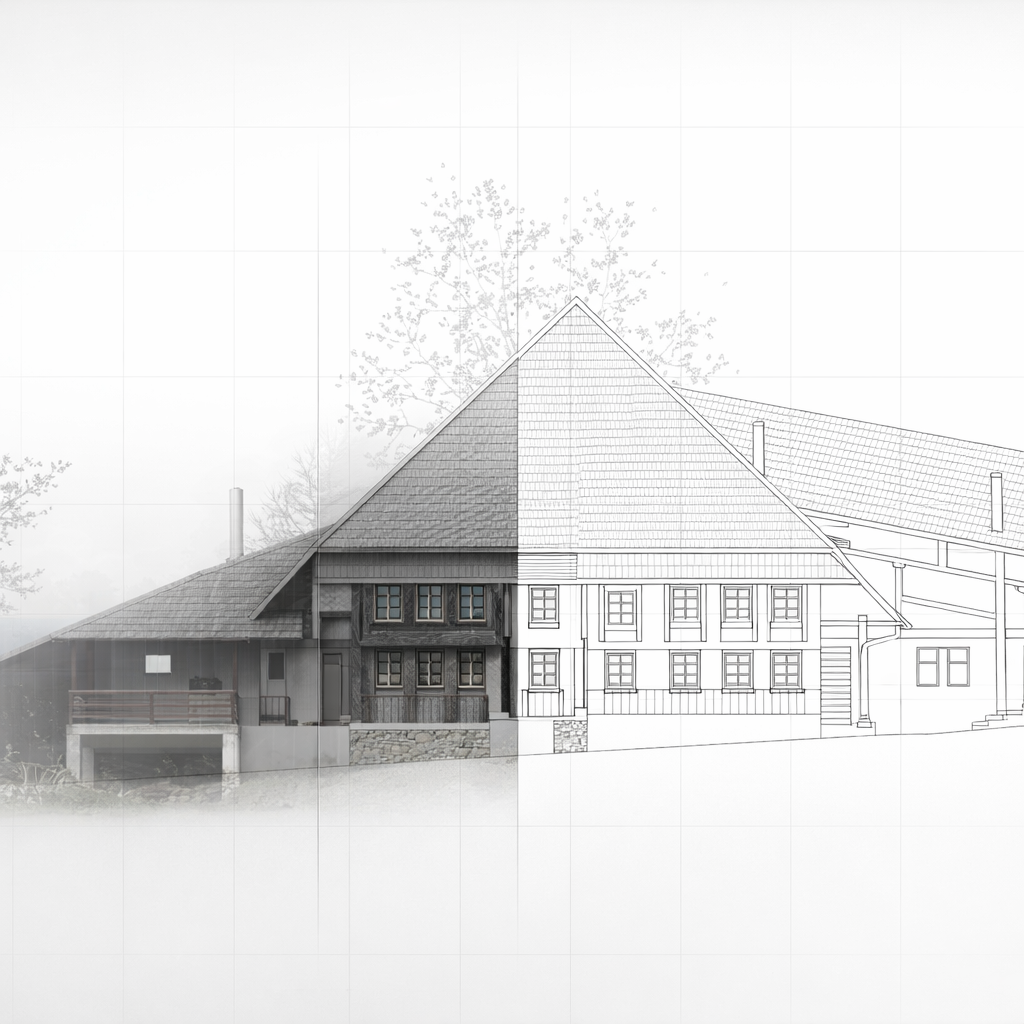
At the center of the project was a diverse building ensemble in the municipality of Bogel in Rhineland-Palatinate. Alongside the former “Alte Post,” the students also surveyed barns, a restaurant, and several additional existing structures.
The brief was deliberately open-ended. The goal was not just to capture the buildings, but to understand them spatially and translate that understanding into reliable as-built documentation – forming the basis for future design work.
One of the first challenges was access: not all interiors were accessible. As a result, many conclusions had to be derived indirectly from exterior scans, such as roof geometries, façade openings, and building heights.
A watchtower as a learning object
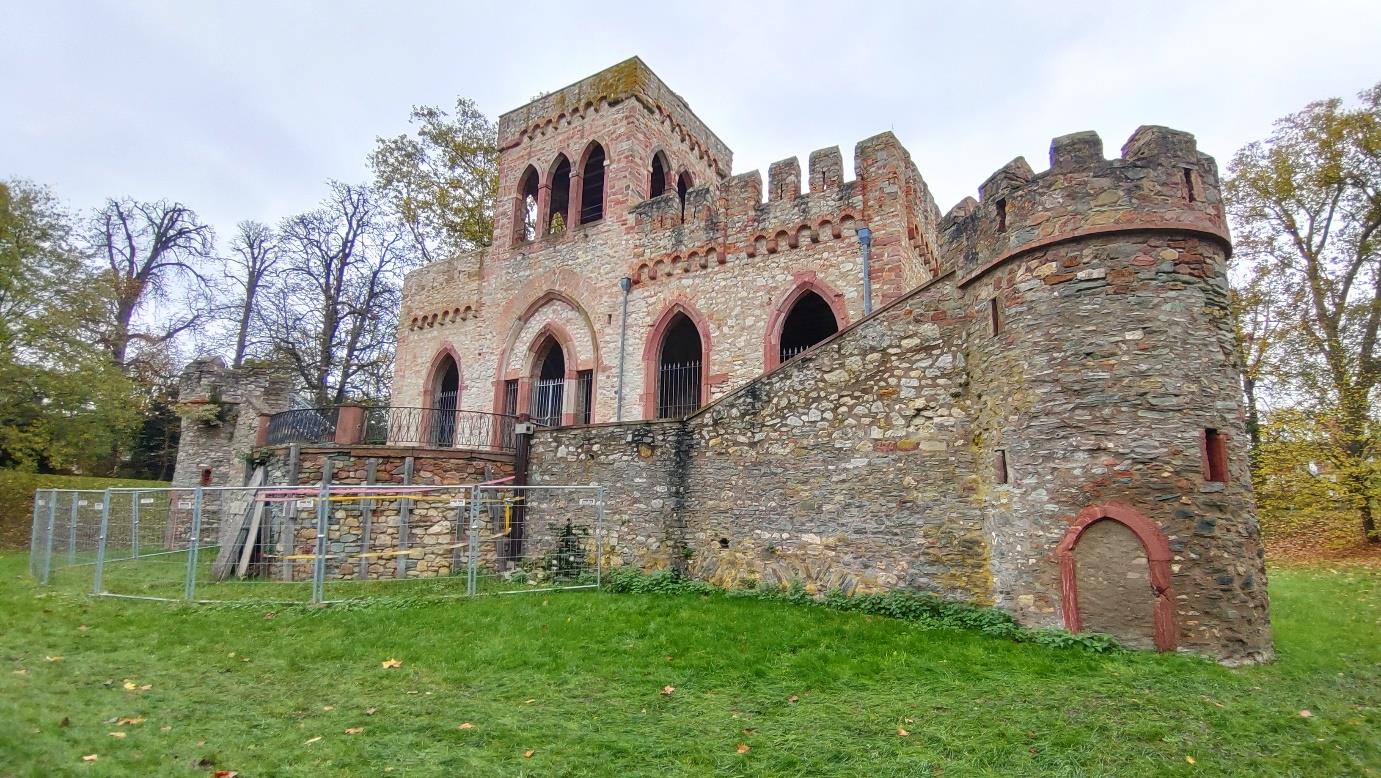
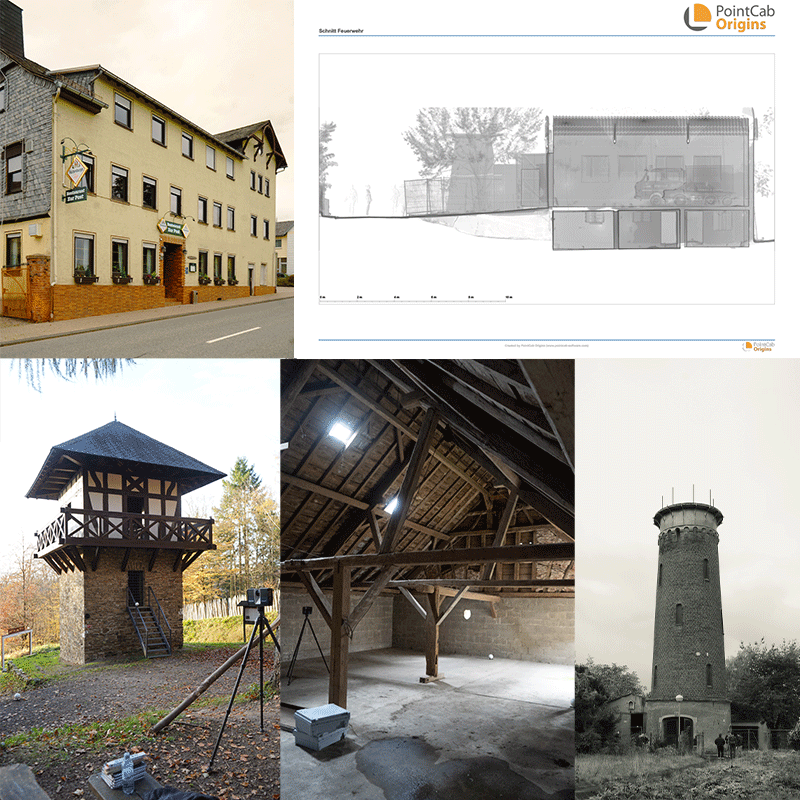
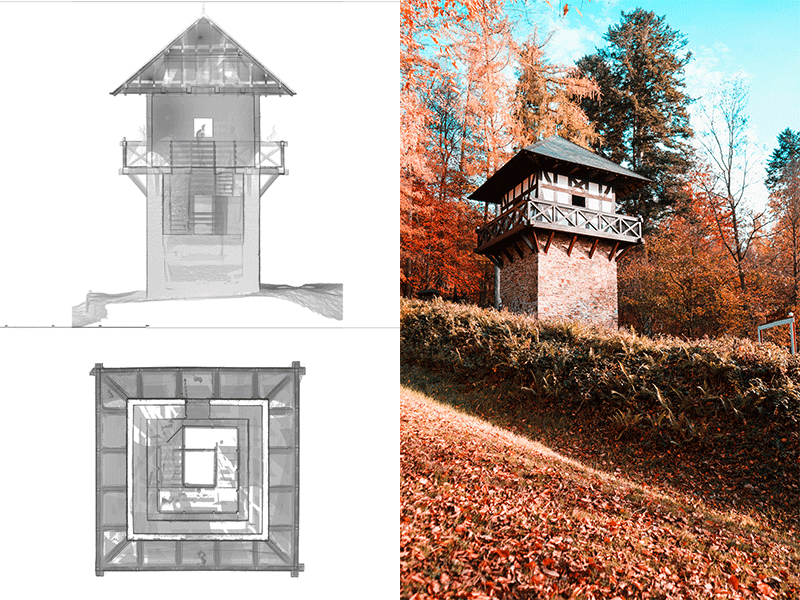
In parallel, the students scanned a reconstructed Roman watchtower along the Limes in Bendorf-Sayn – an intentionally chosen structure with very different constraints.
Tight interior spaces, complex lines of sight, and an active environment made it an ideal training scenario. Here, the focus was less on producing plans and more on understanding the scanning process itself:
- Where should the scanner be positioned?
- When are a few targets enough, and when are they not?
- How do terrain and perspective affect registration?
These variations quickly made one thing clear: there is no single “standard” workflow.
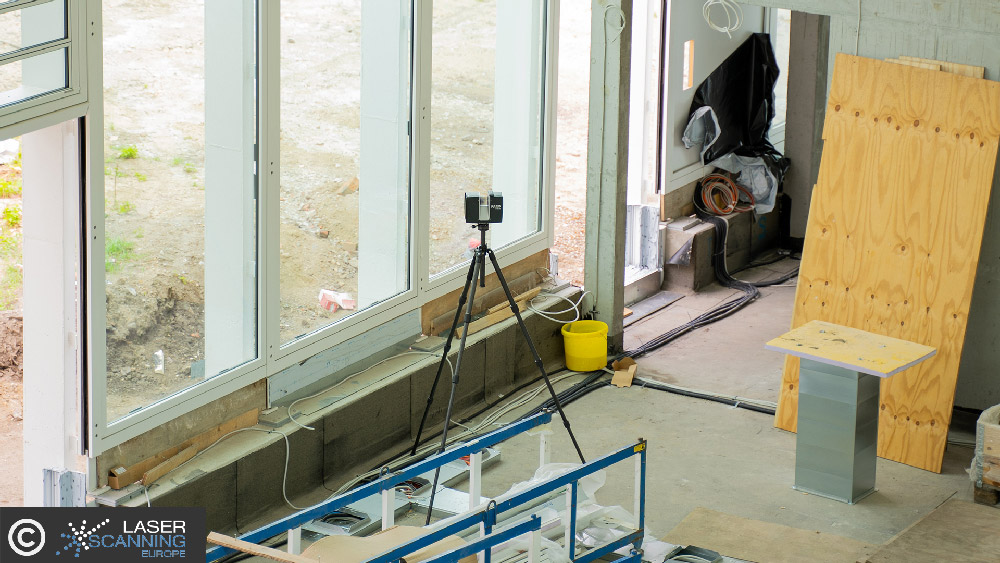
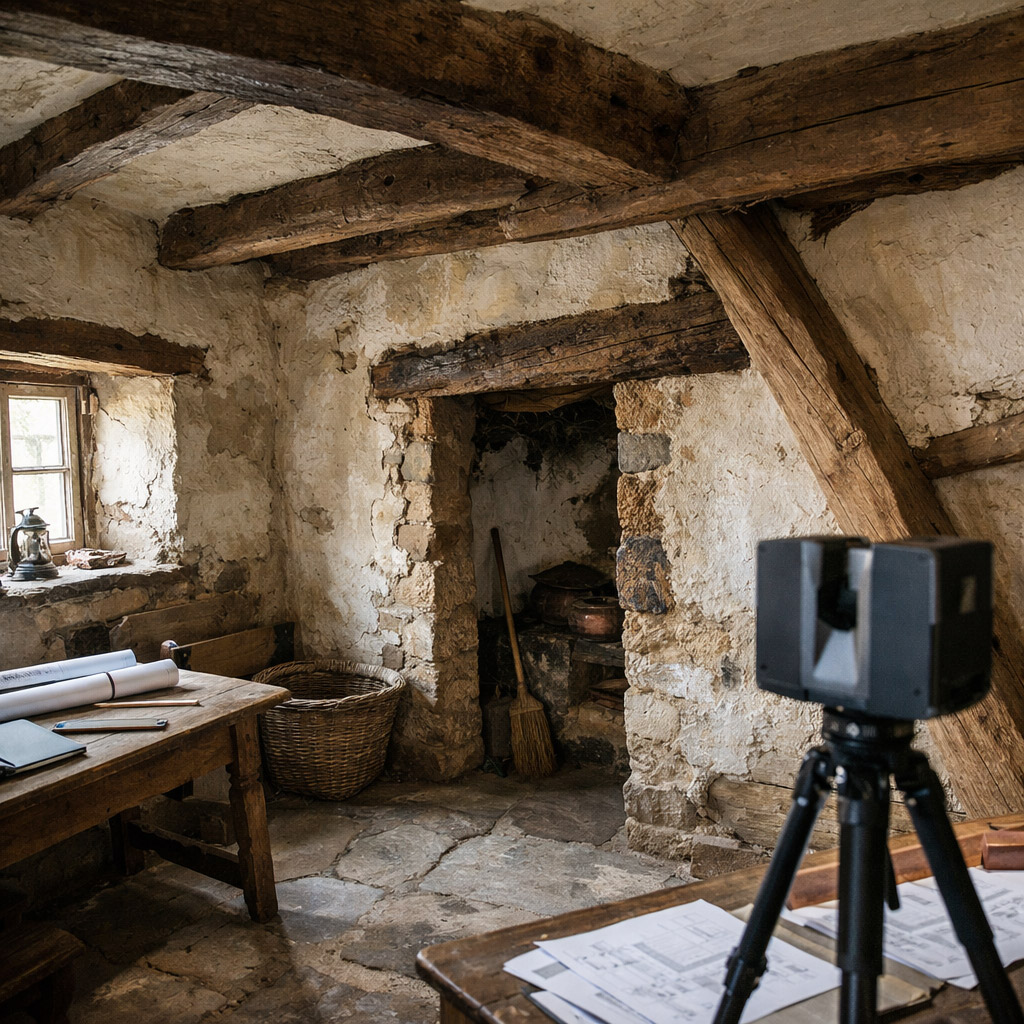
The first step matters: planning the scan on site
Even before the scanner was set up, it became clear how critical preparation is.
Scan positions had to be chosen carefully to minimize occlusions. At the same time, practical constraints – accessibility, time pressure, and environmental factors – played a much larger role than expected.
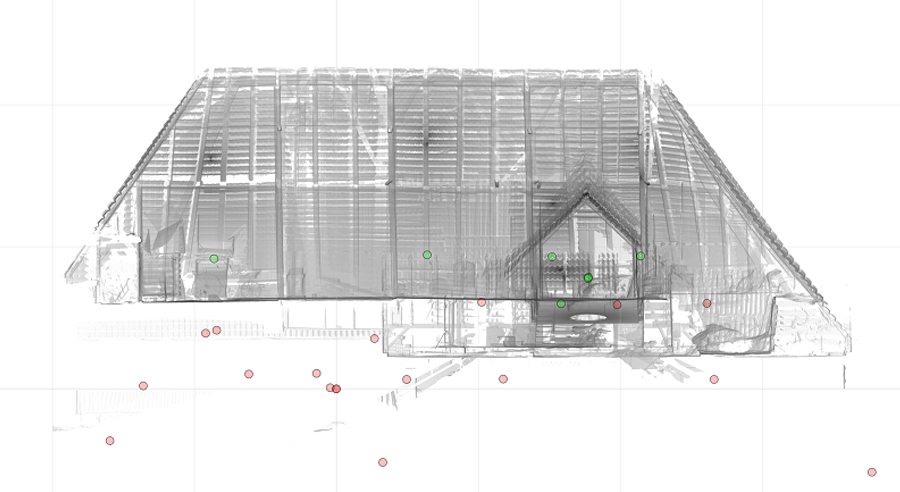
The placement of reference targets proved particularly critical. They need to be clearly visible for registration, but not obstructive – something that sounds simple in theory, yet turned out to be surprisingly error-prone in practice.
When theory meets reality
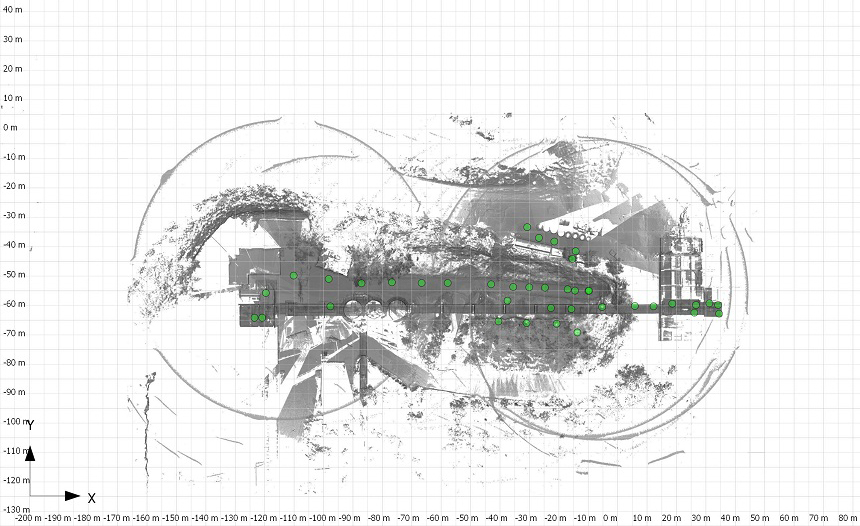
The scanning process itself worked reliably. The real challenges came from external factors and the subsequent data processing.
Rain and wind affected scan quality, while passersby or animals occasionally moved reference targets. In some cases, scans had to be repeated because they could no longer be properly registered.
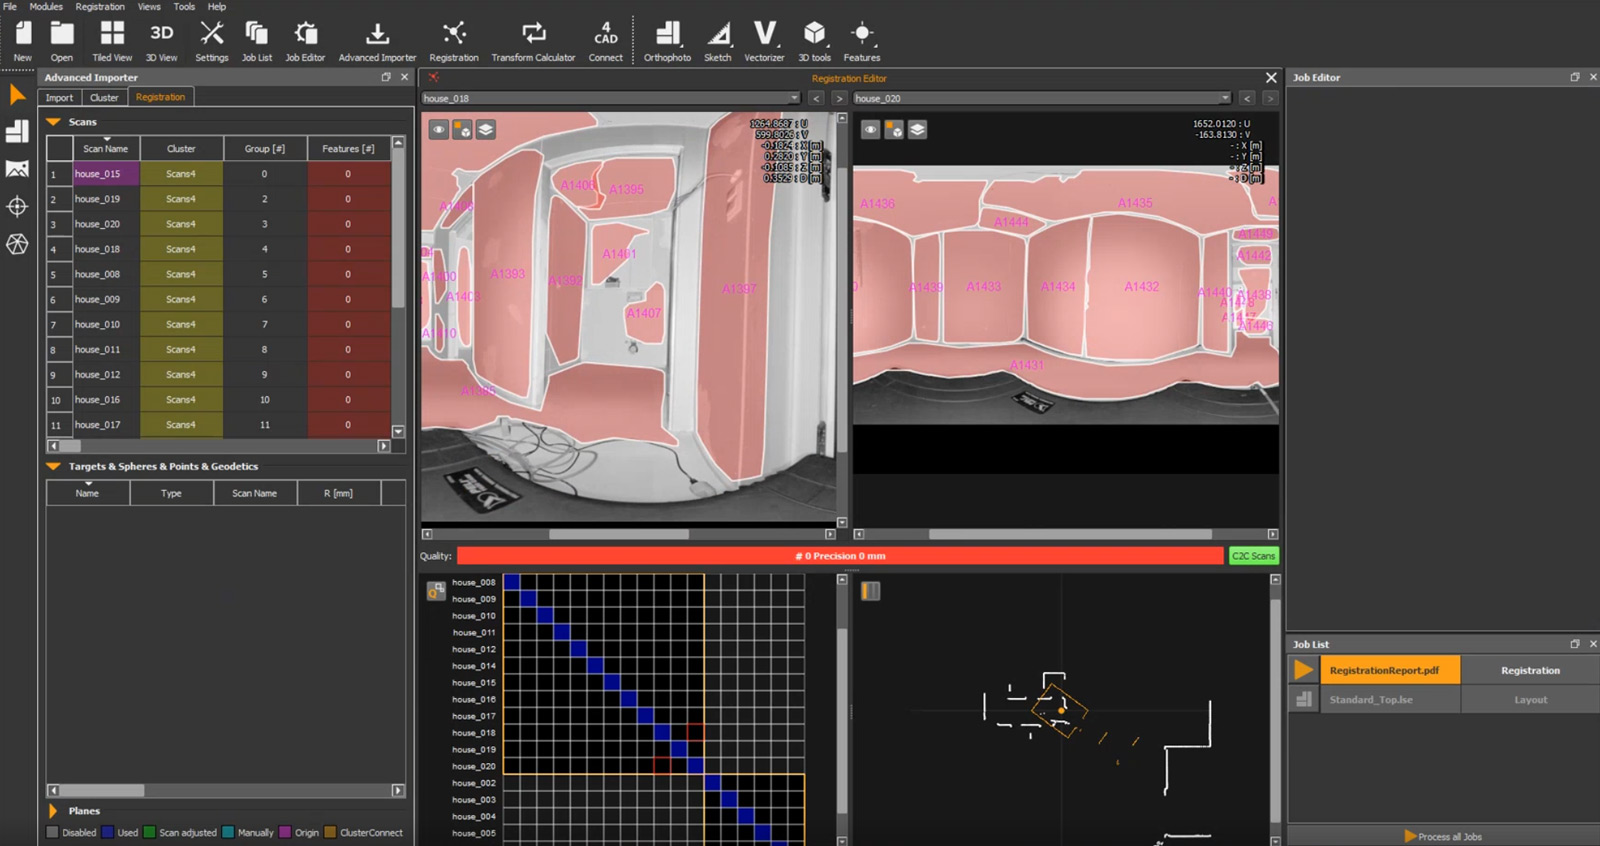
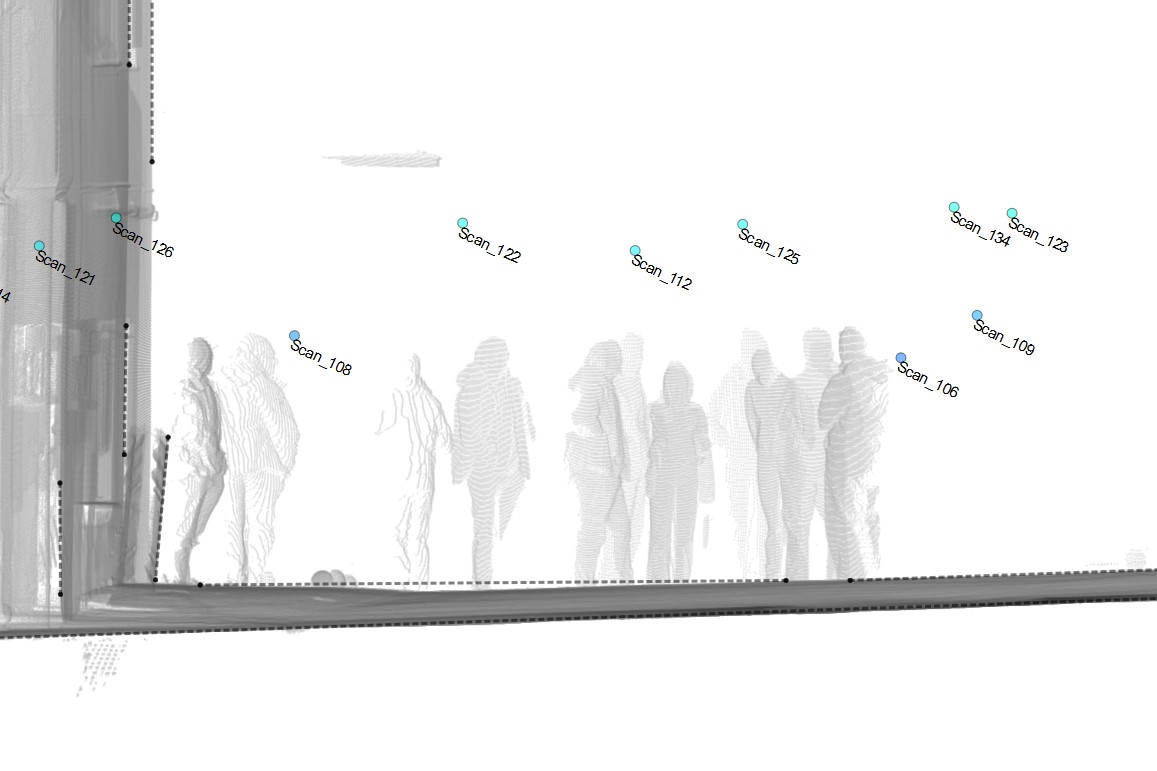
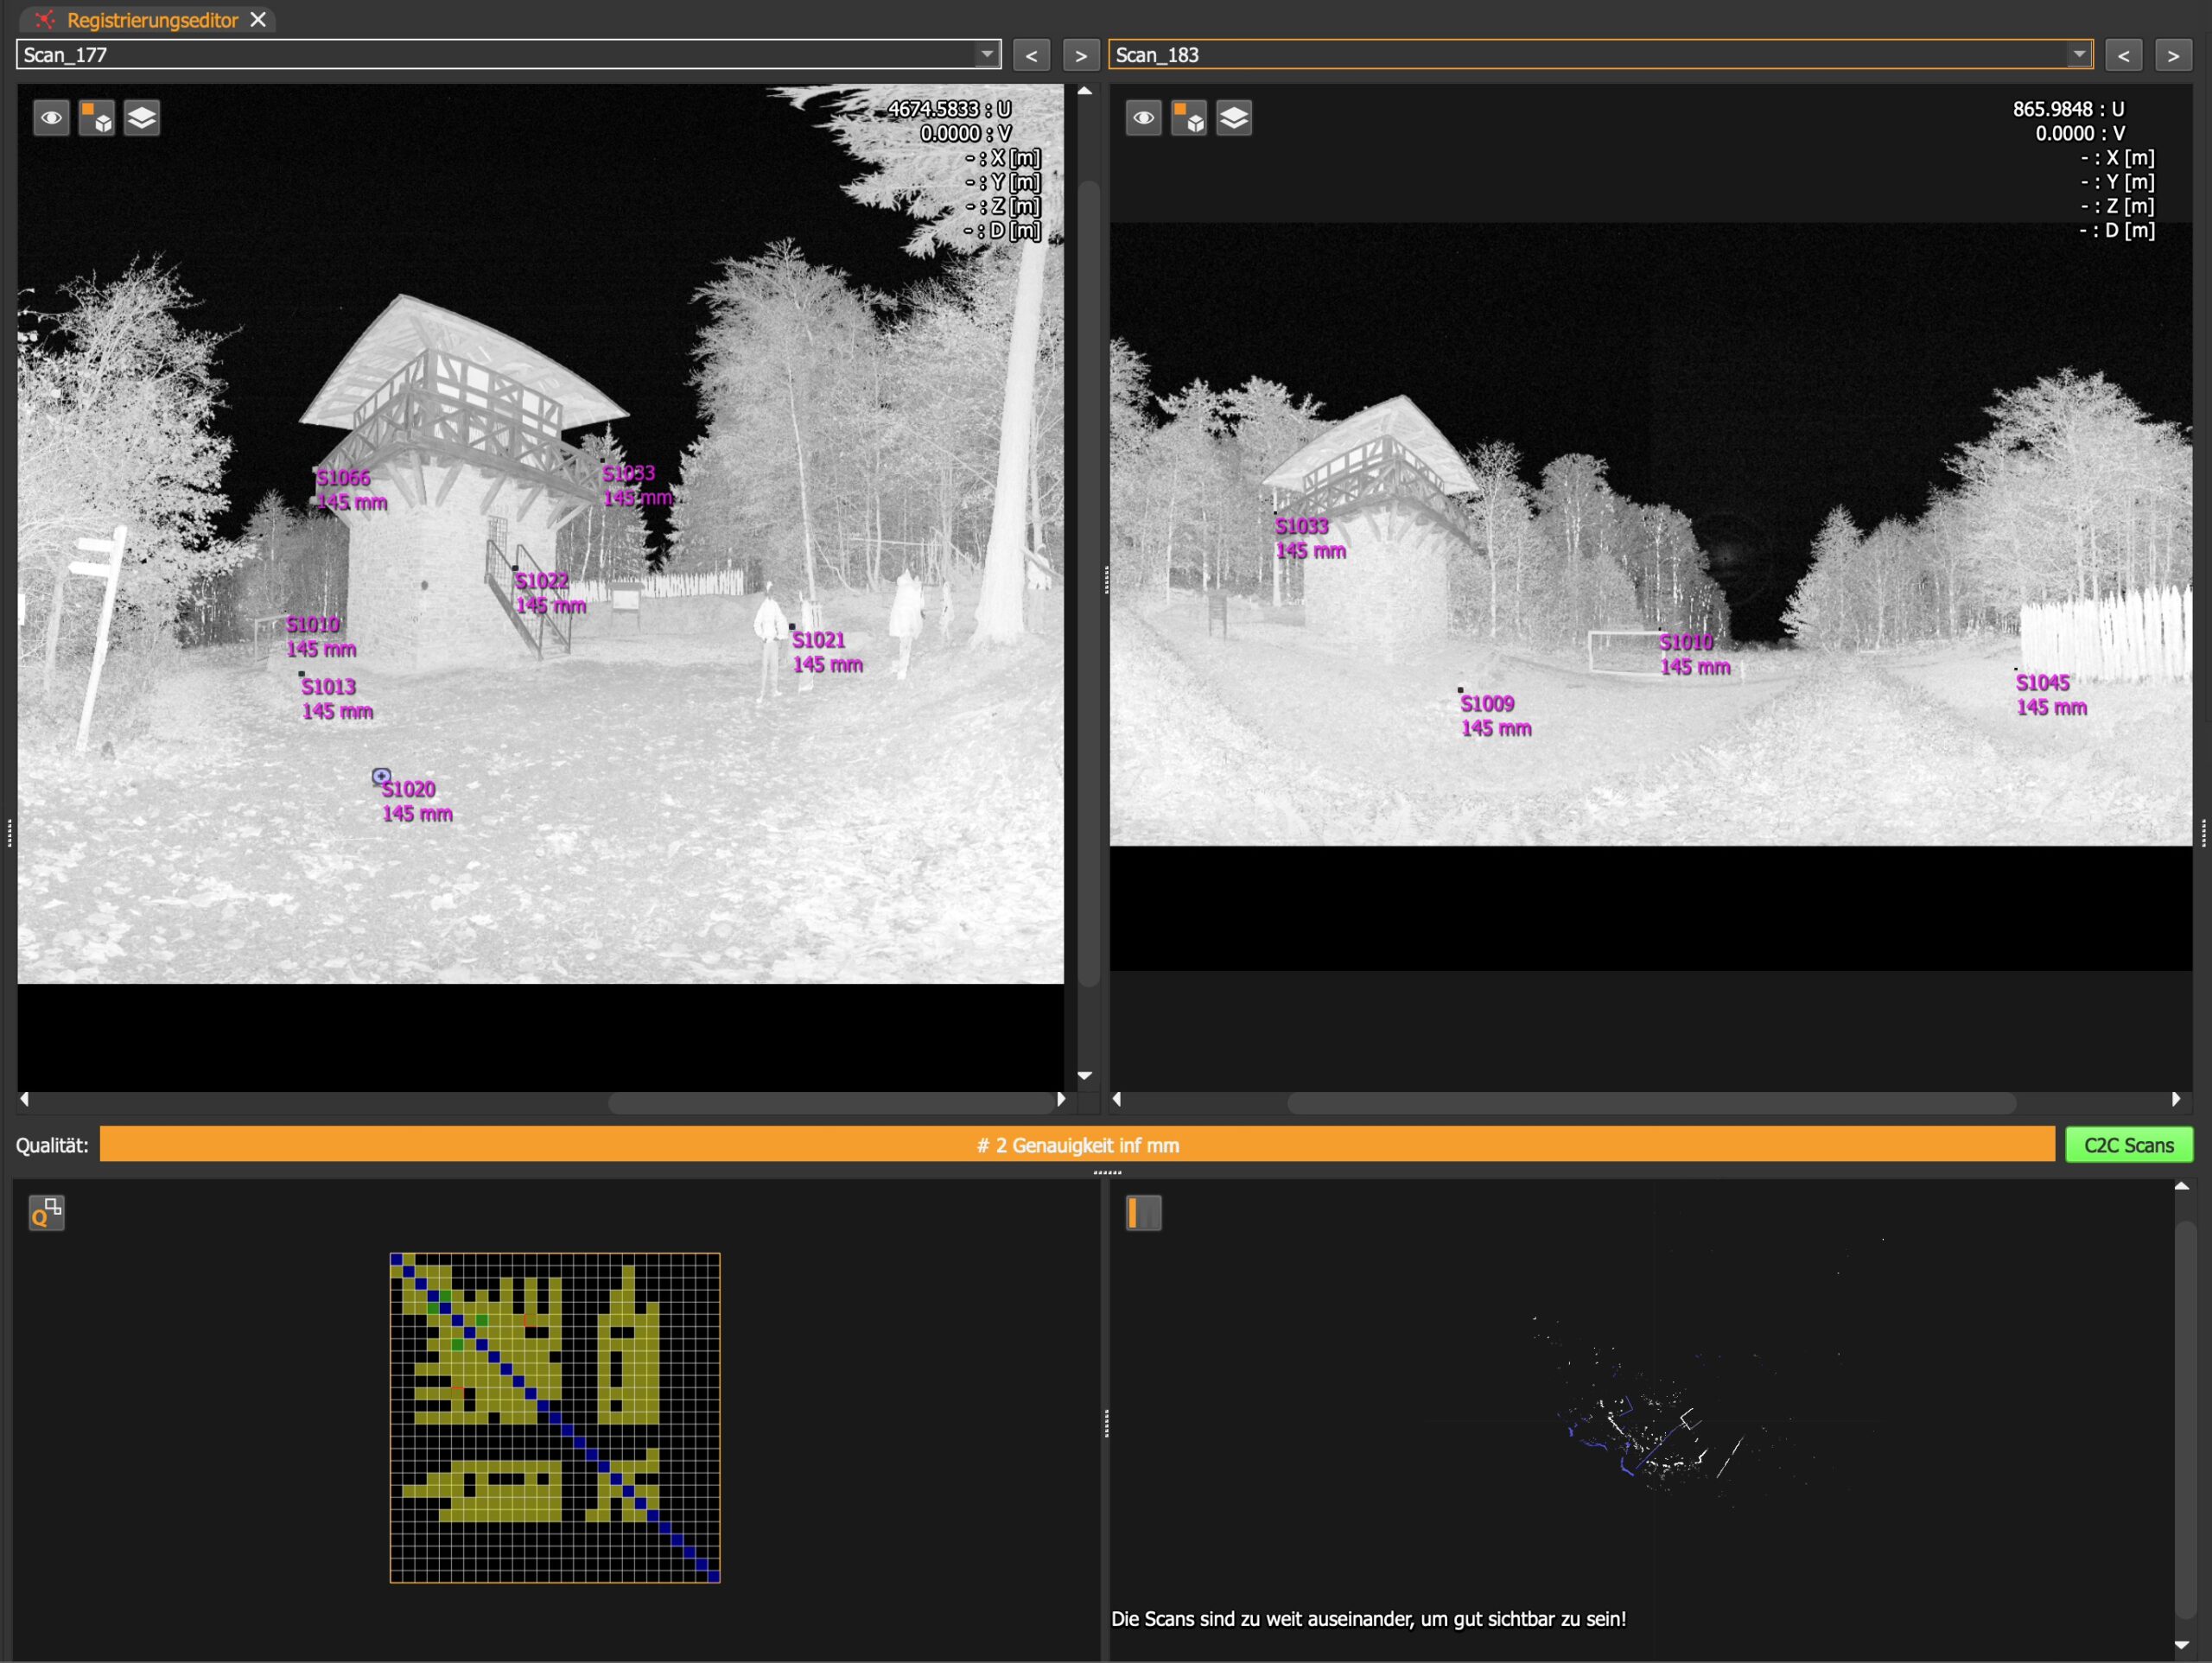
These issues became even more apparent during the alignment of individual scans. Missing links, shifted targets, or incomplete scan paths made registration far more time-consuming than expected. In addition, typical artifacts – such as people captured during scanning or incorrectly assigned reference points – had to be manually cleaned up before a consistent point cloud could be achieved.
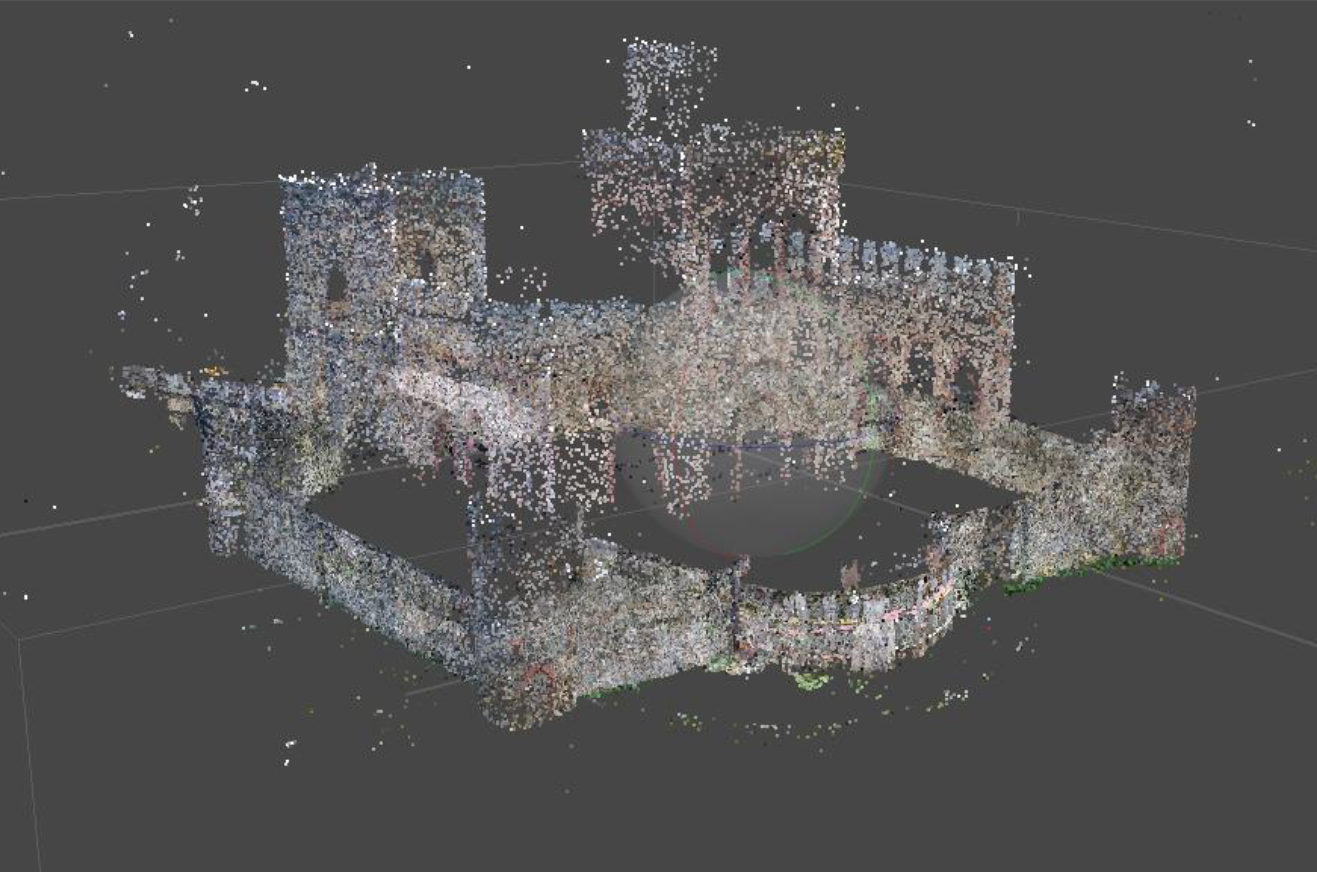
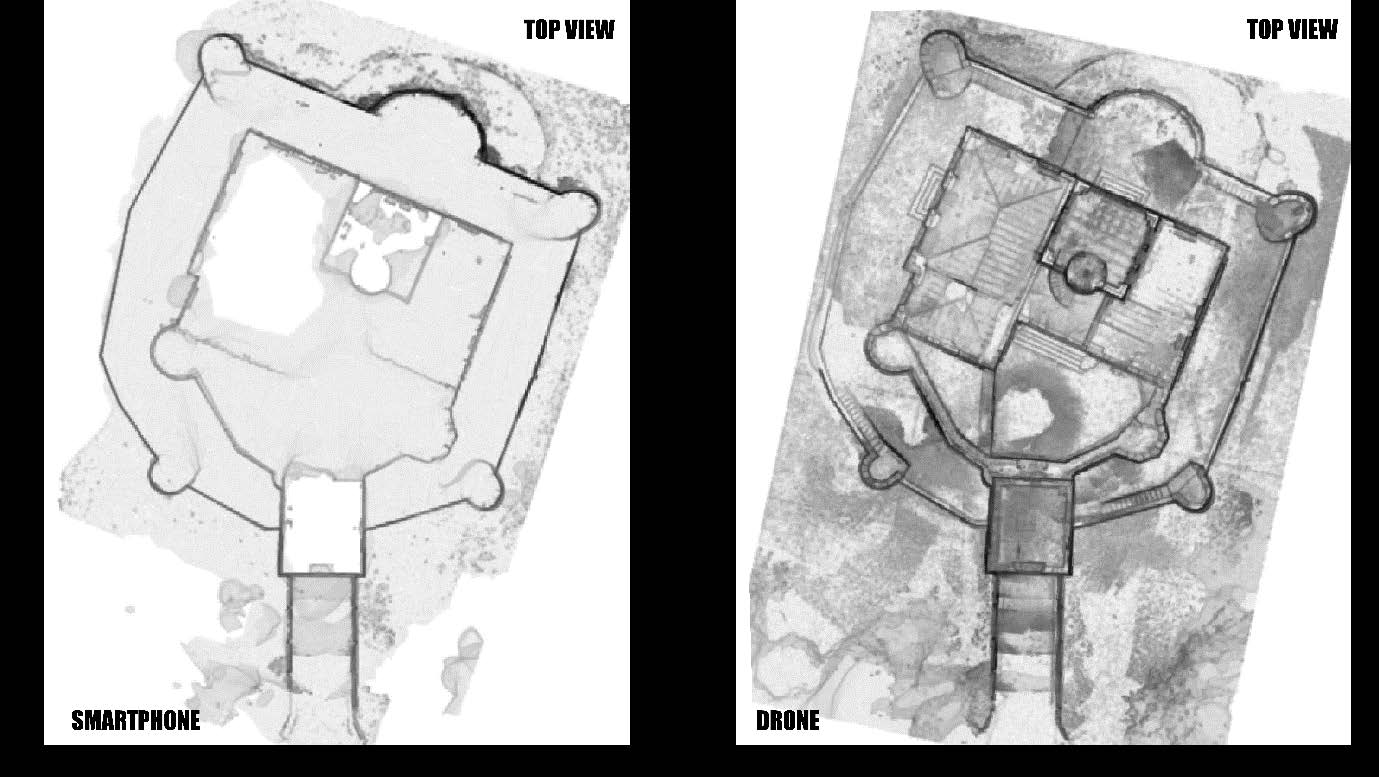
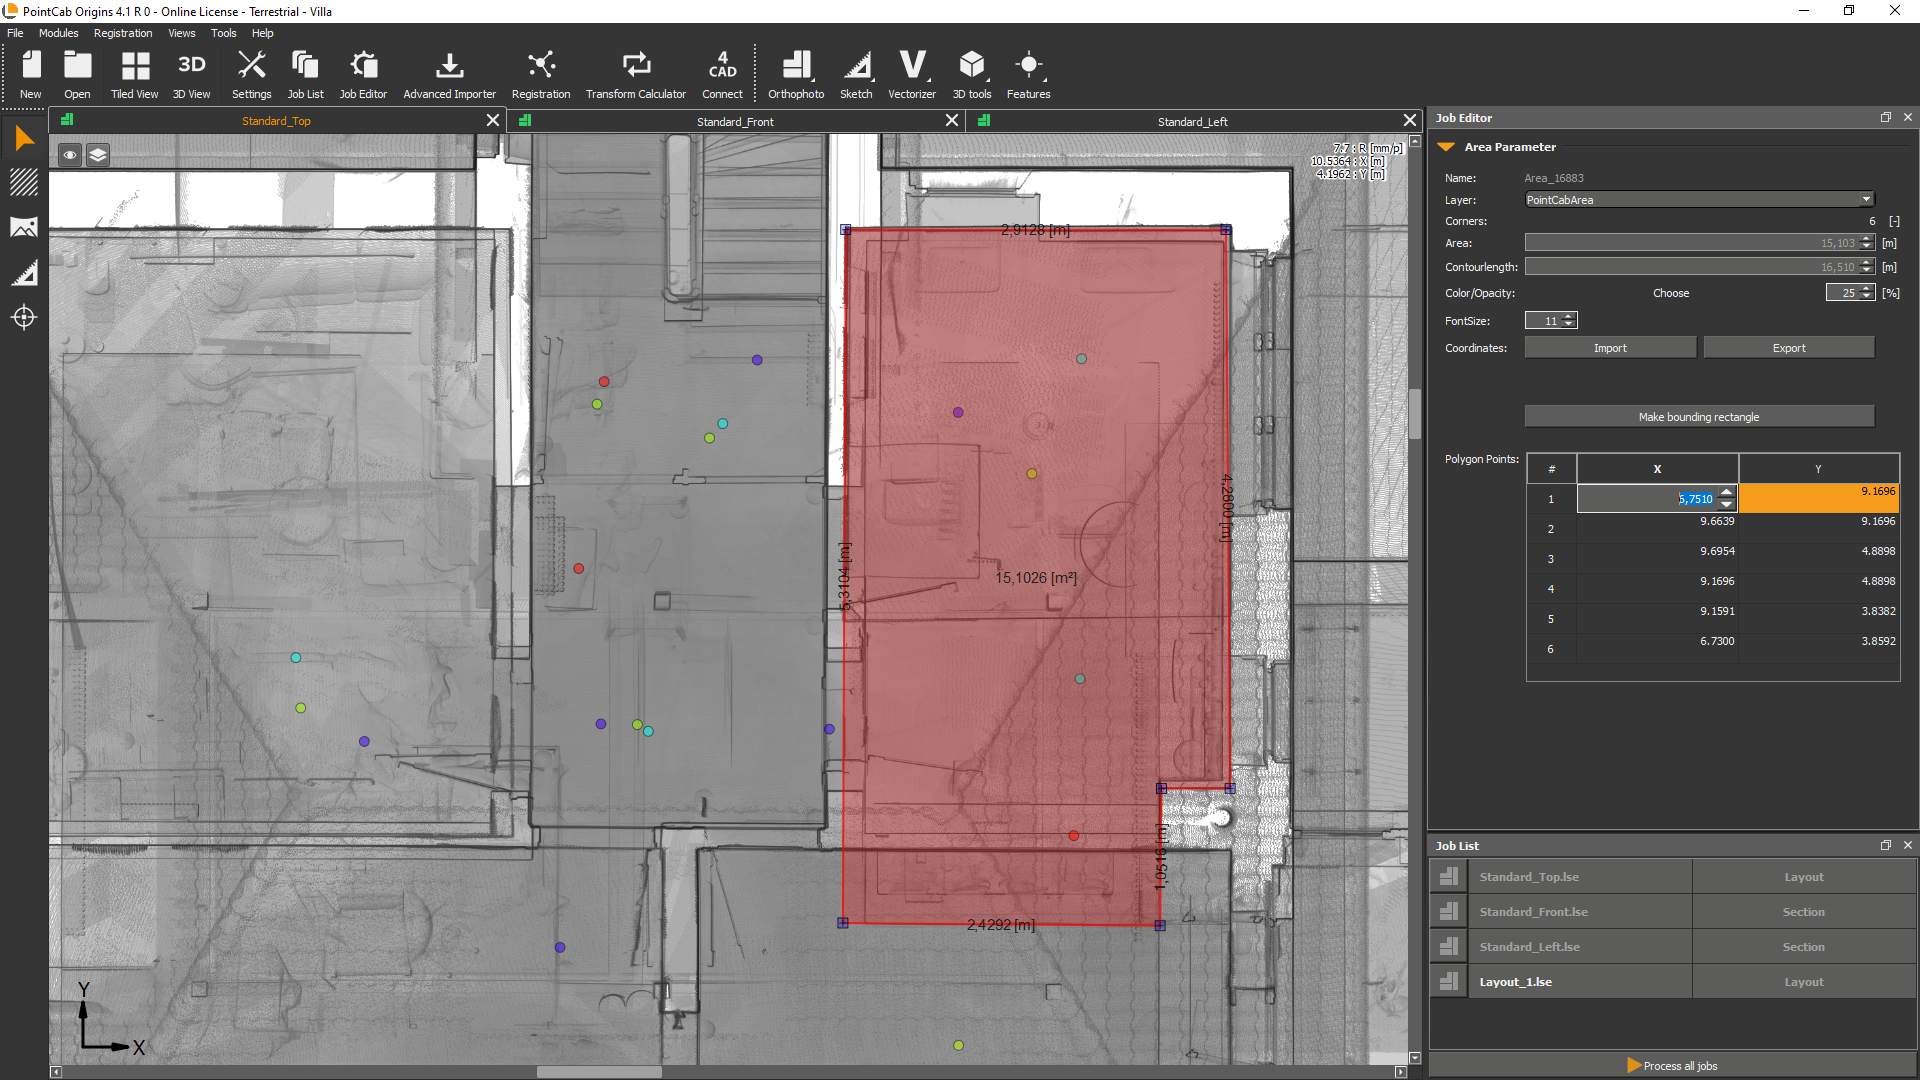
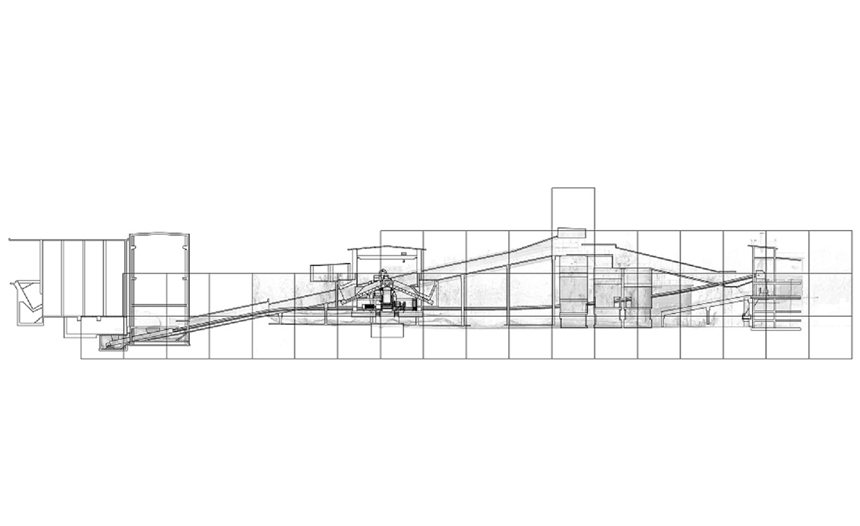
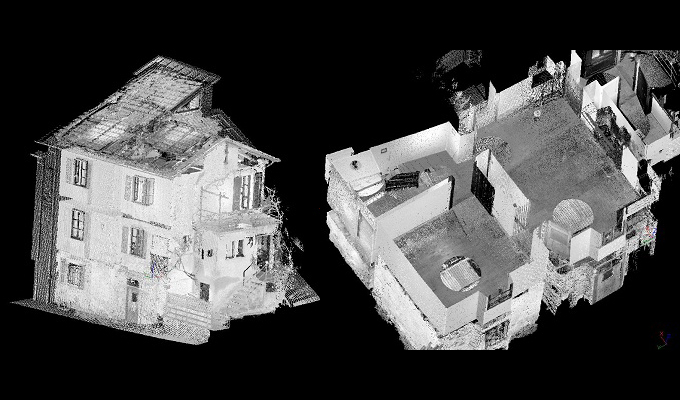
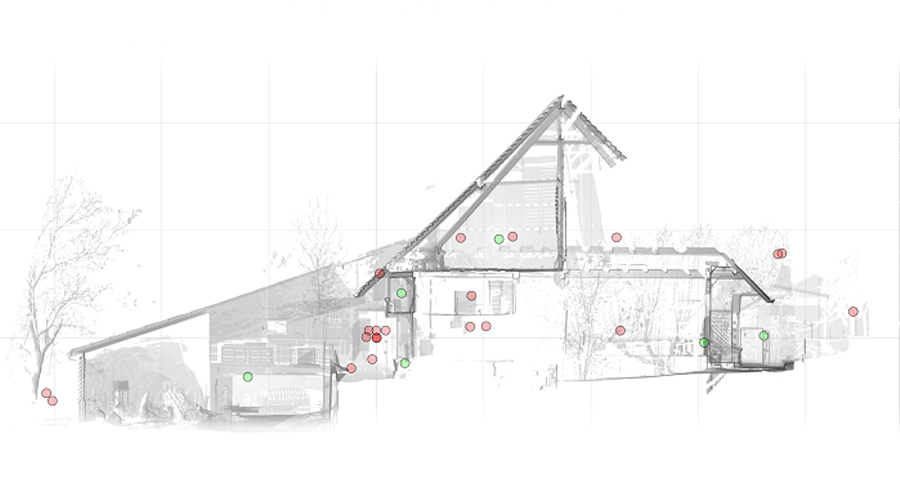
Working with the point cloud: from export to drawing
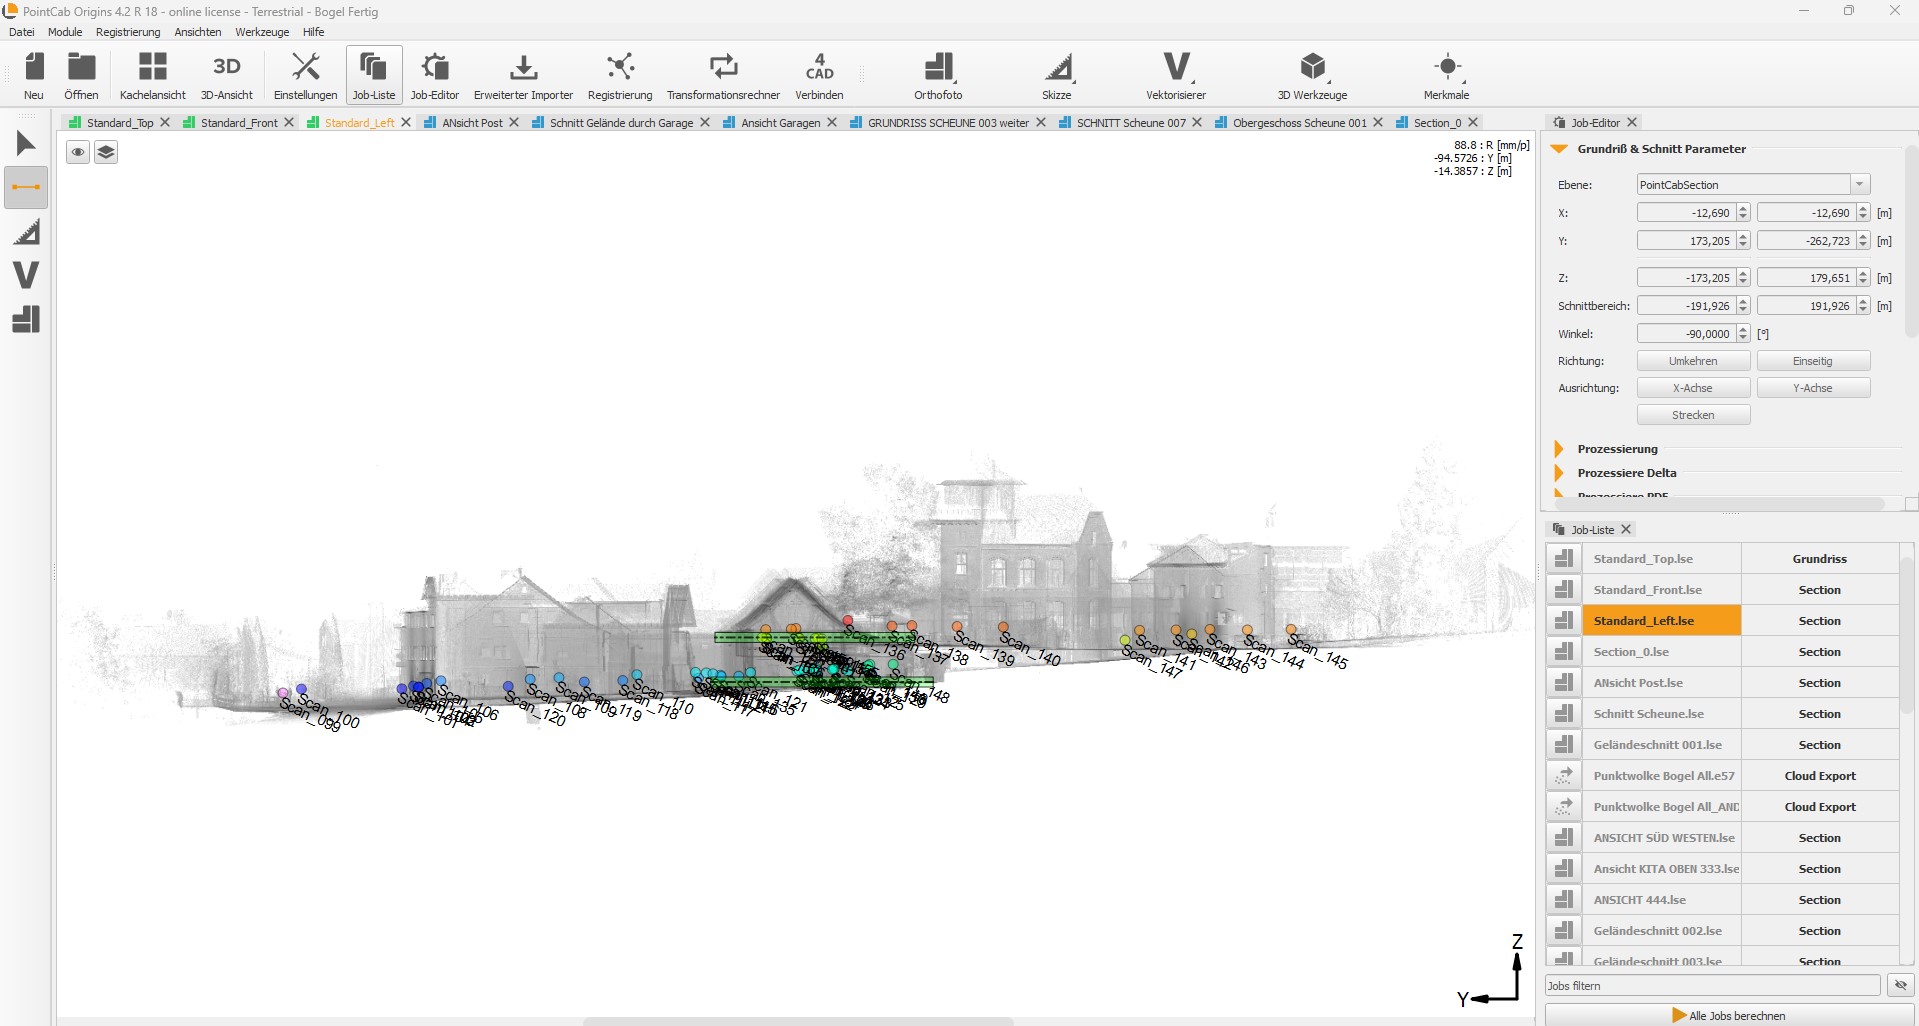
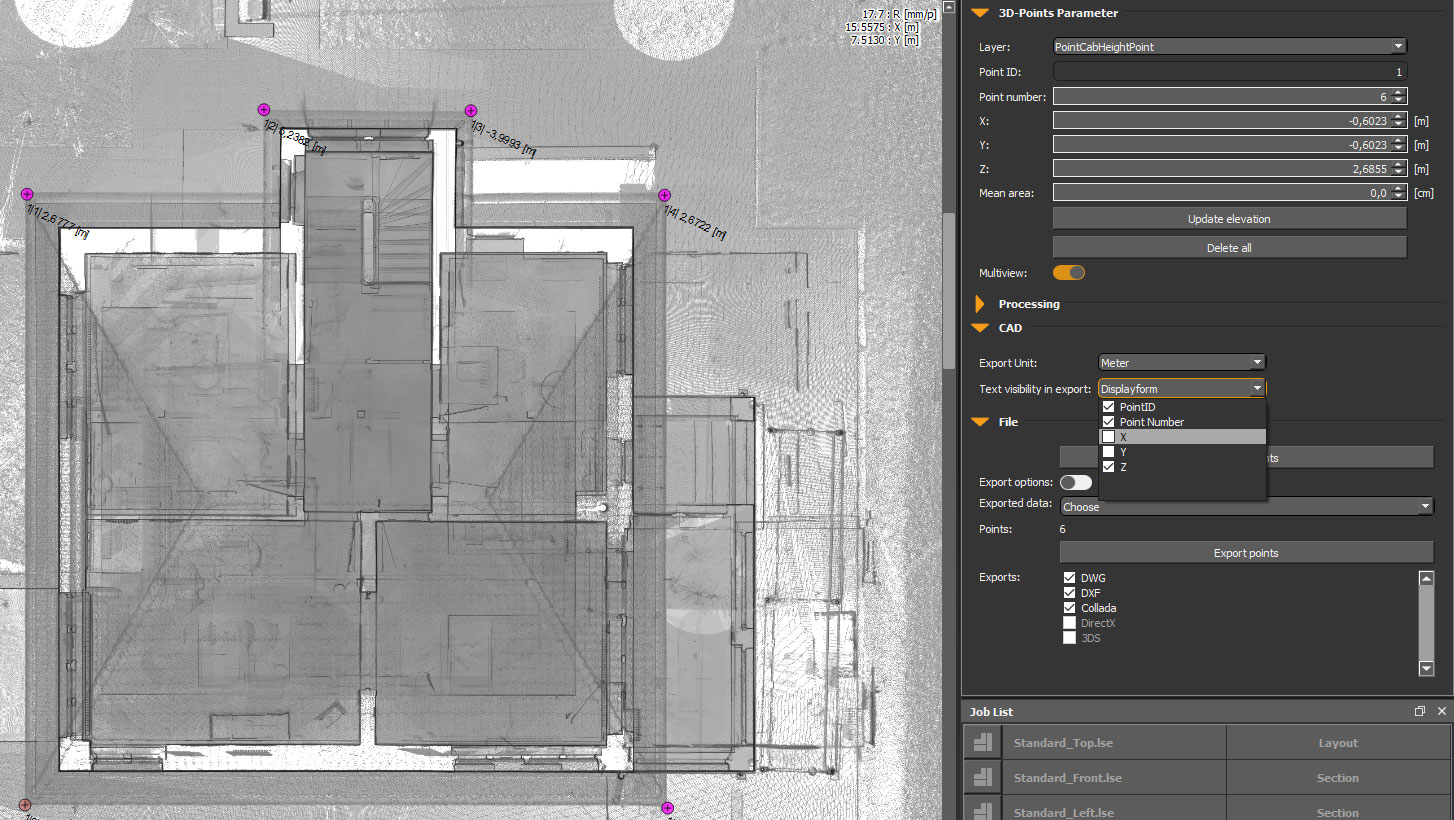
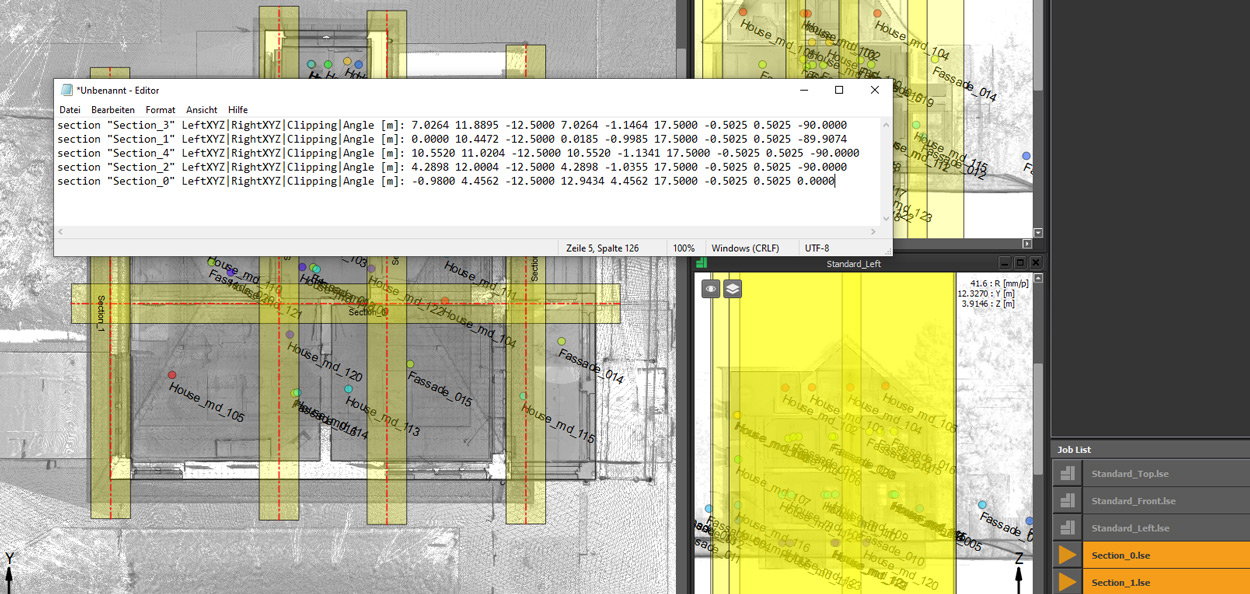
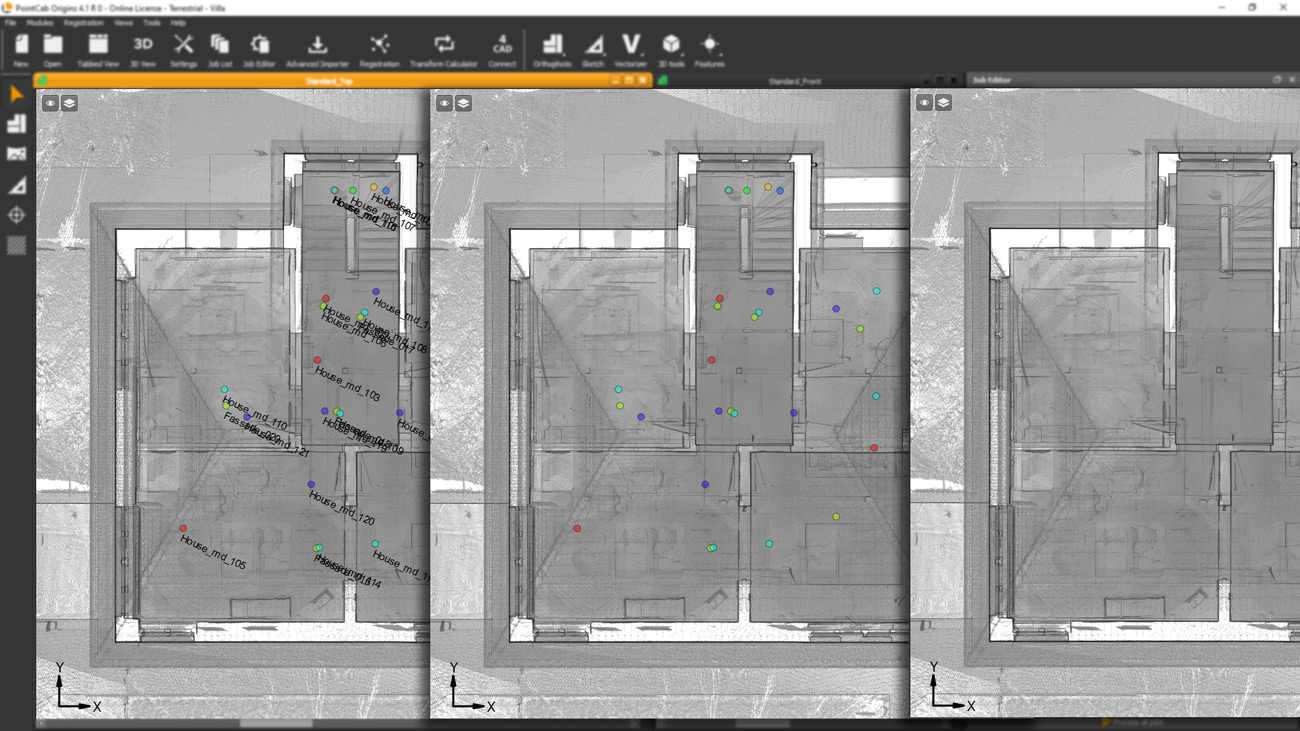
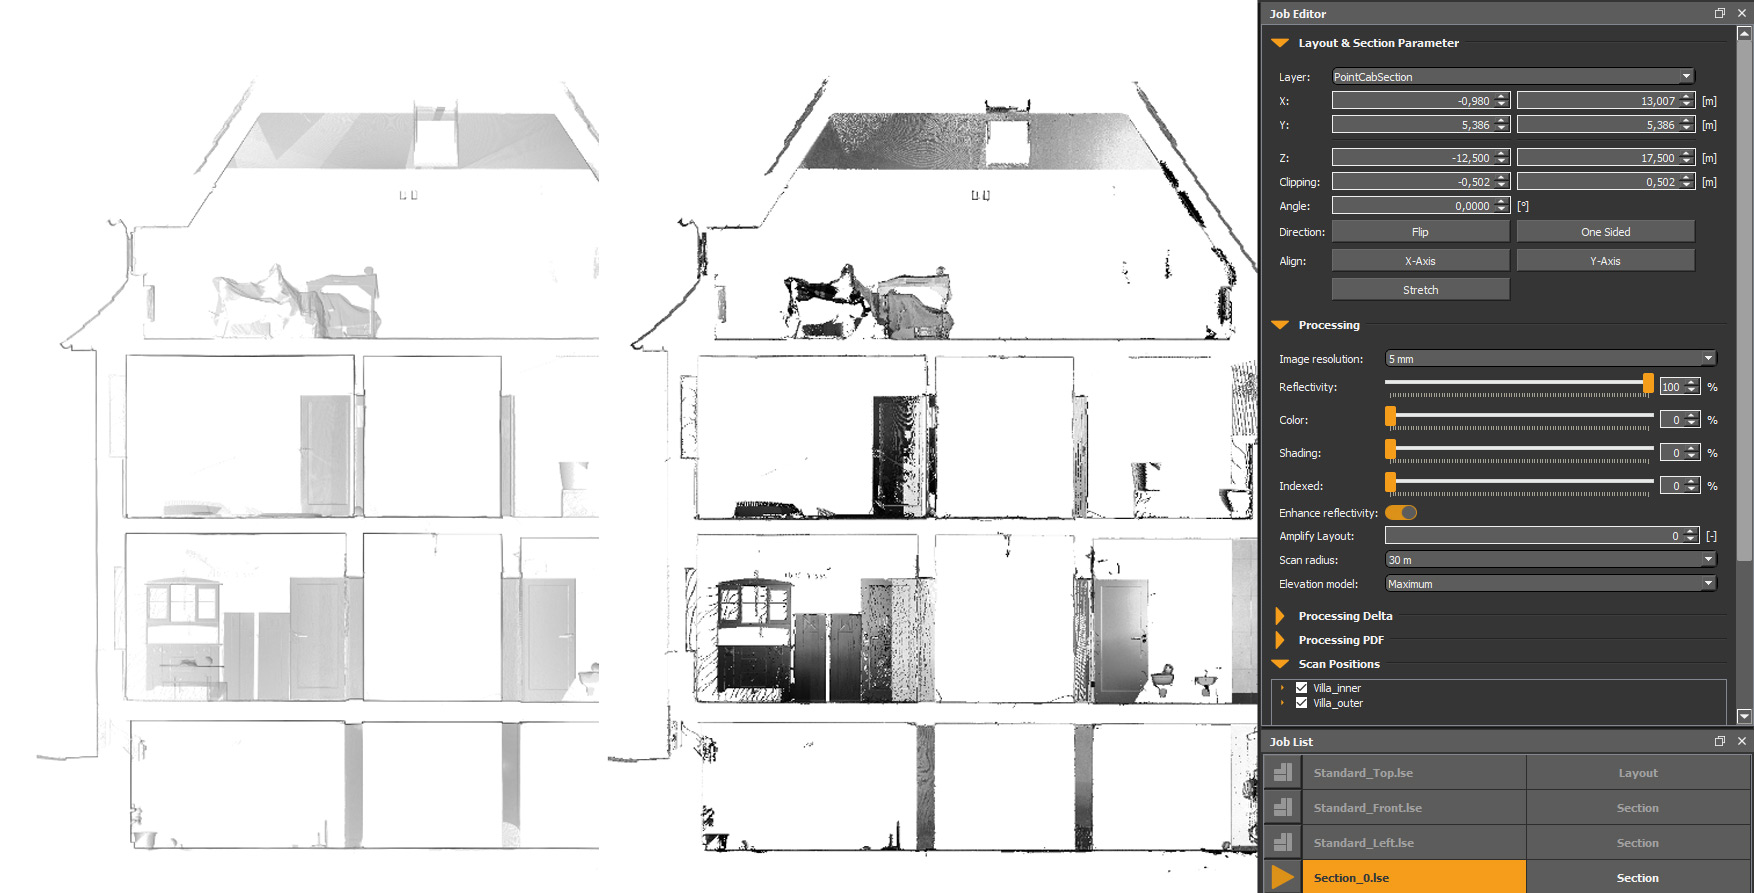
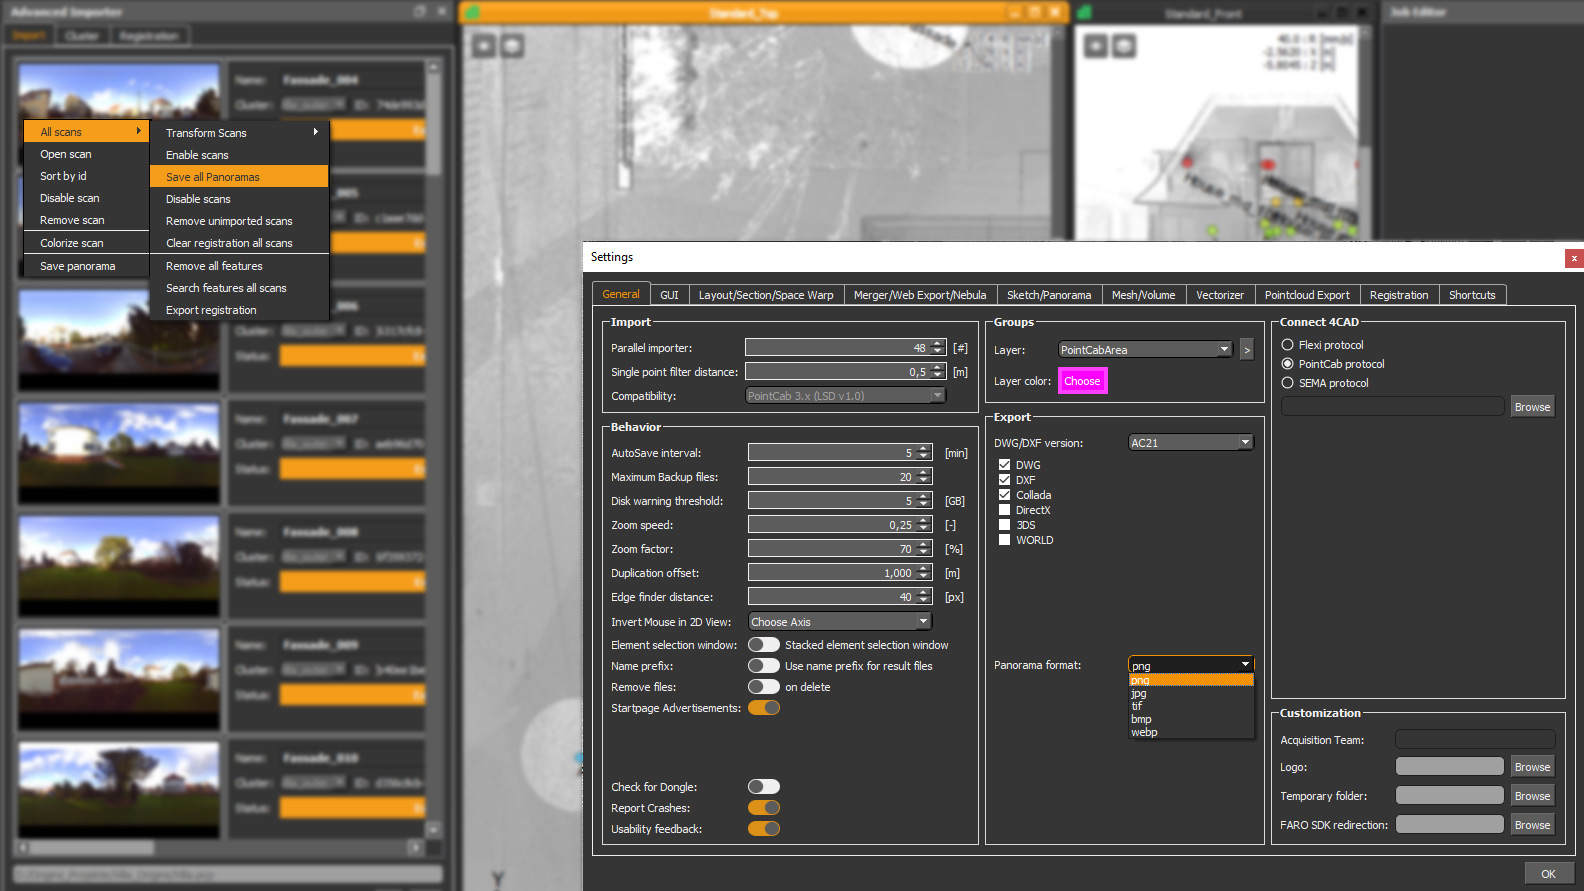
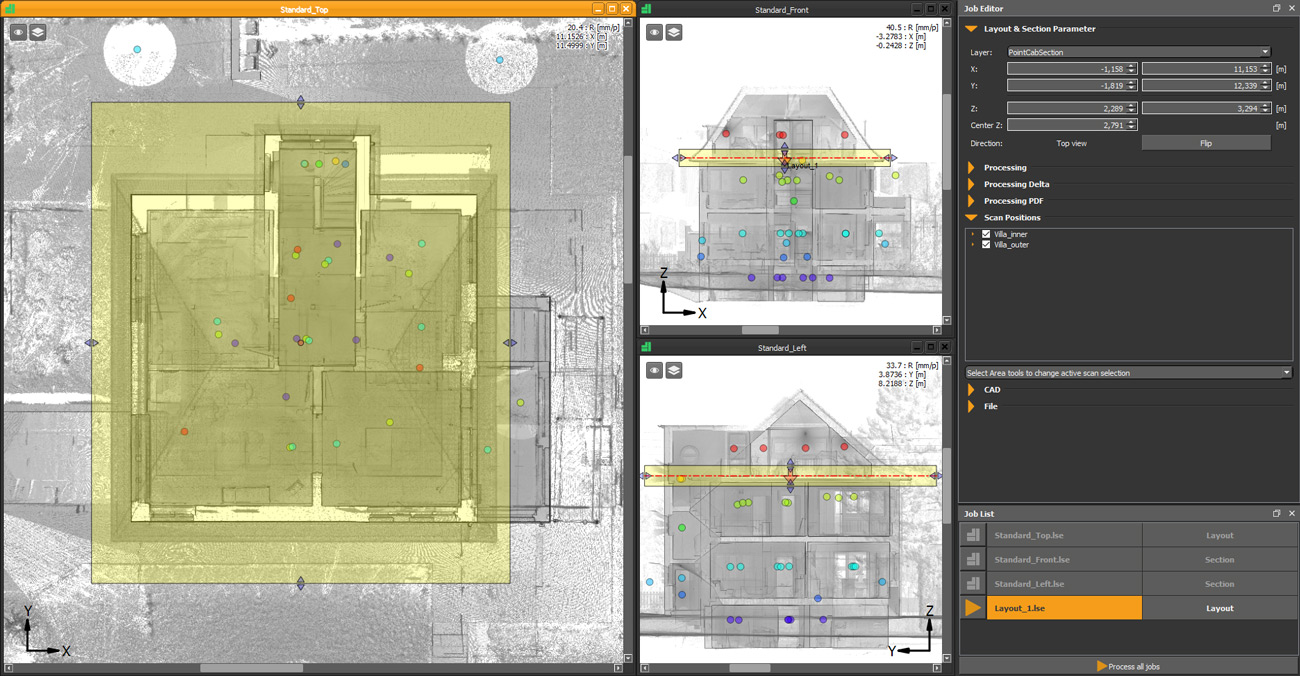
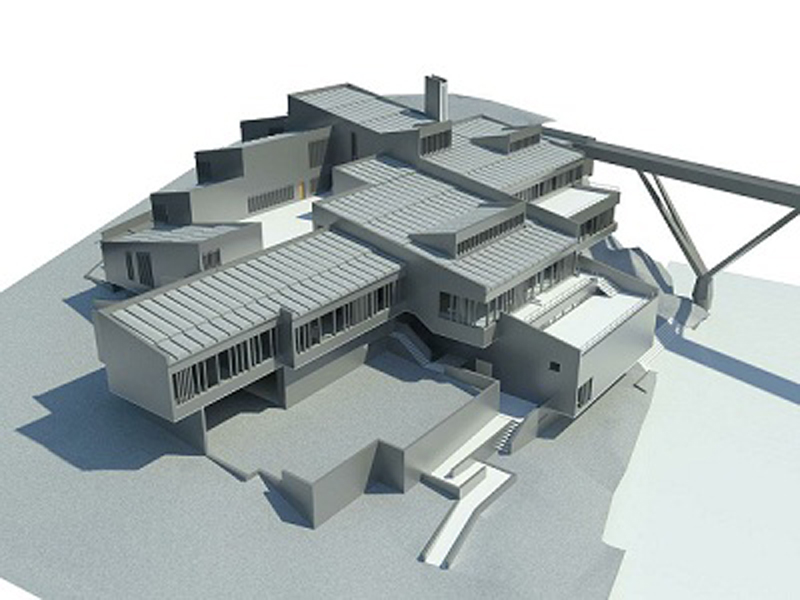
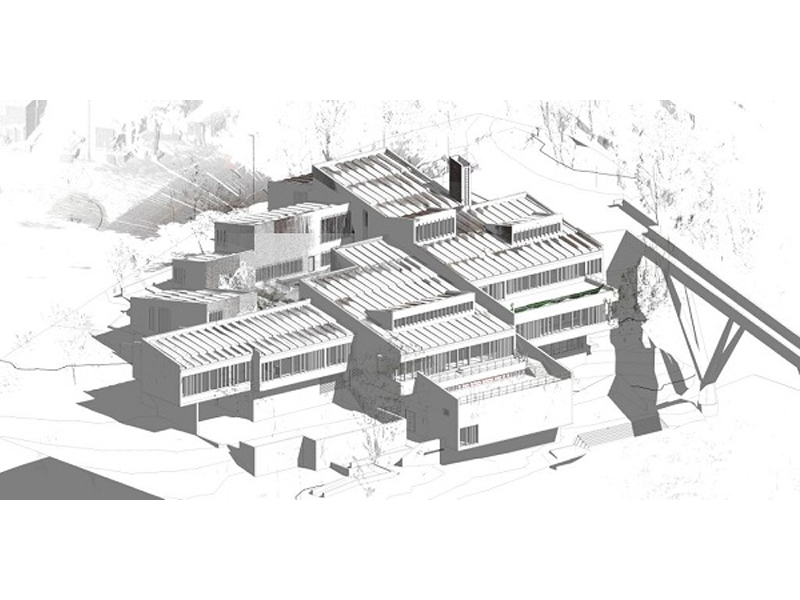
Once the point cloud was complete, the actual analysis began in PointCab Origins. For the first time, the students could work directly within a digital representation of the building – taking measurements and deriving floor plans. The ability to access the full geometry at any time proved to be a major advantage over traditional methods.
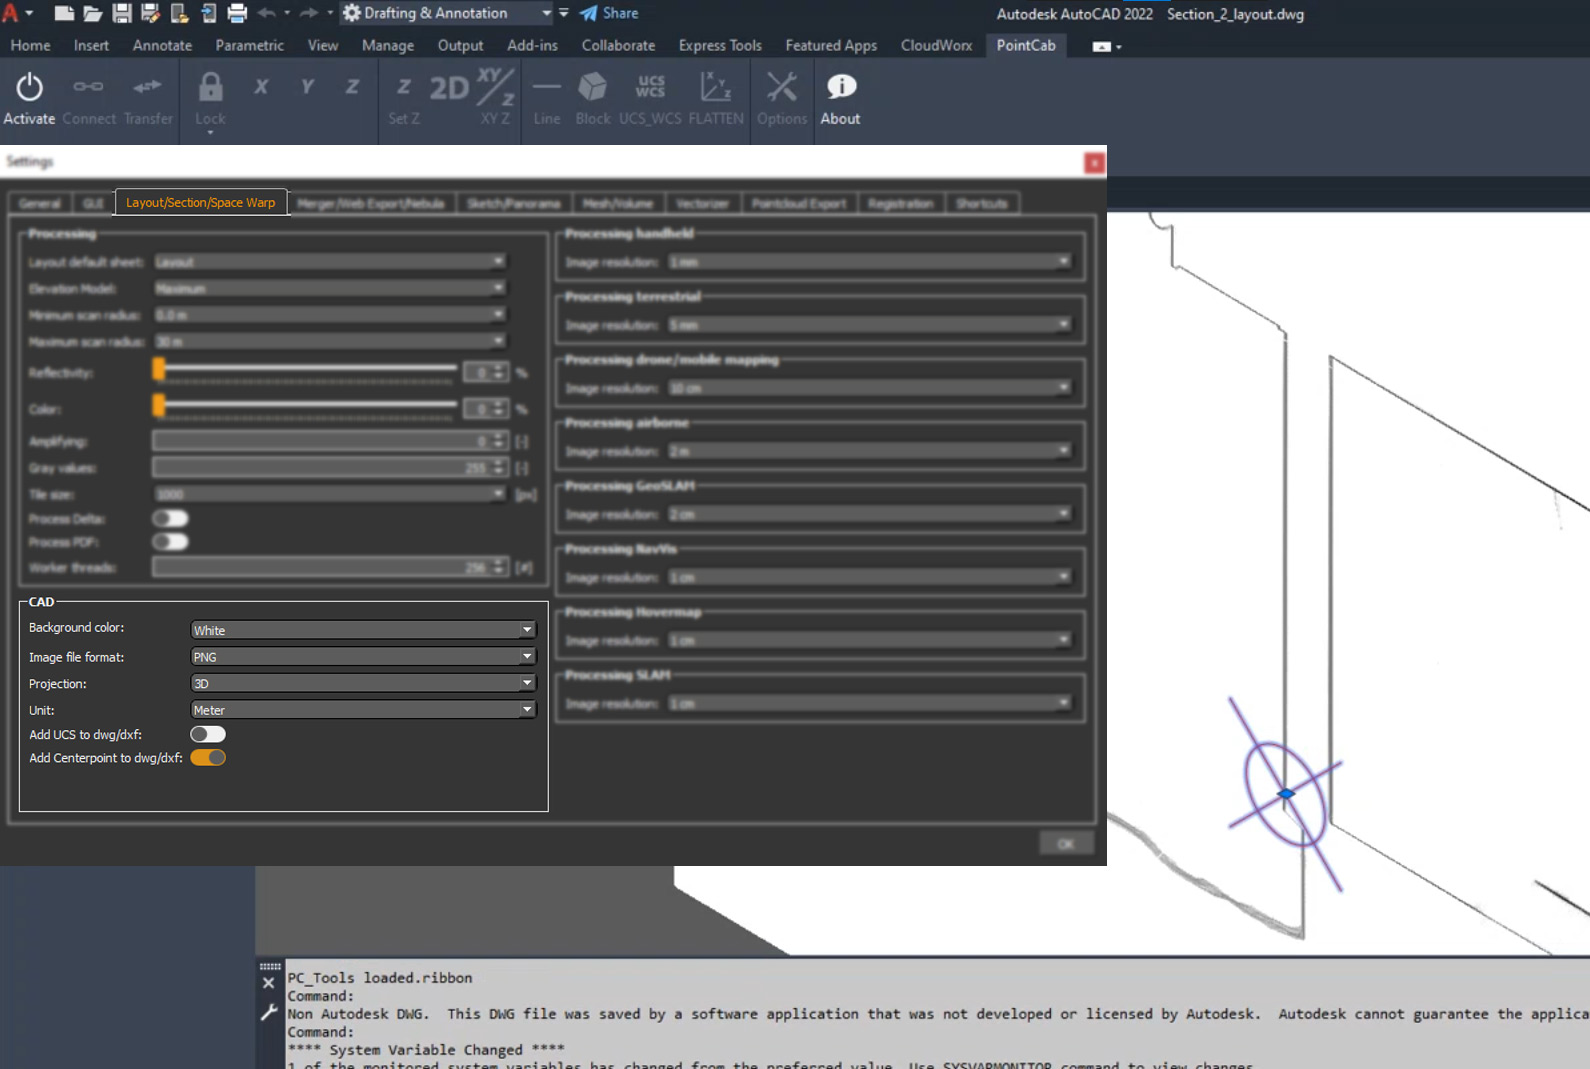
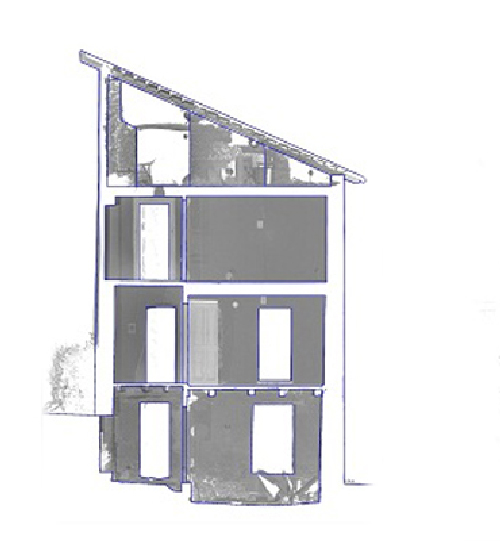
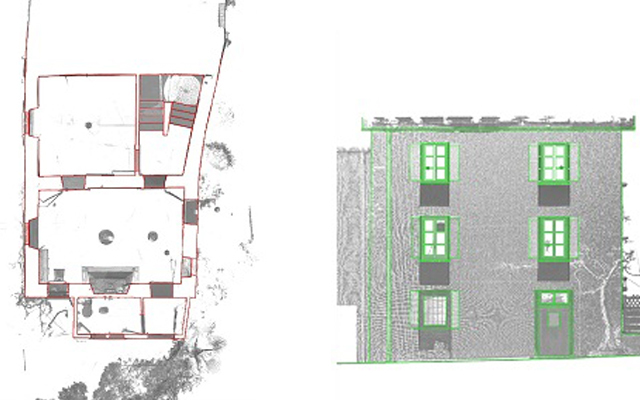
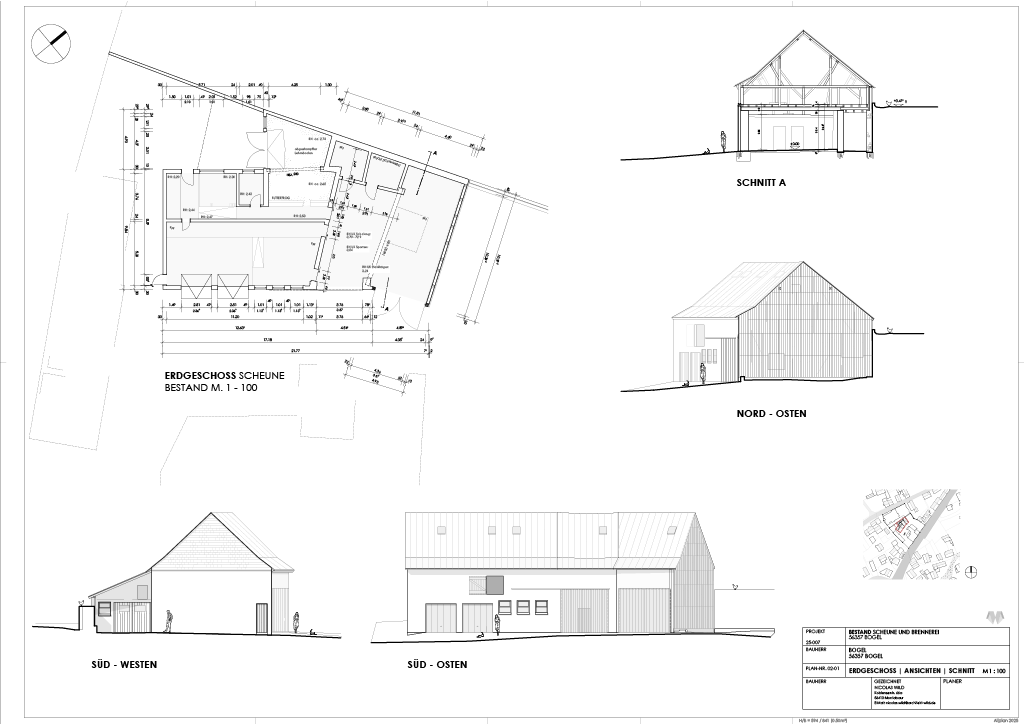
However, it only became clear later on that the full potential of PointCab Origins had not been fully utilized. A significant amount of time was spent manually redrawing exported PDFs in CAD software. Although vector-based workflows in Origins were tested, they were not pursued further due to time constraints. As the students later learned from tutorials, tools like the Vectorizer or even a properly aligned orthophoto import could have significantly streamlined the process.
Instead, the exported data had to be processed, scaled, and adjusted within the CAD environment. In some cases, scale issues occurred and were initially misinterpreted. Only later did it become clear that these could have been avoided entirely by adjusting the sheet format directly in PointCab Origins, which allows for accurate, scaled PDF outputs.
This highlights a typical beginner effect: without a full understanding of the software’s capabilities, users tend to build unnecessarily complex workflows.
The underestimated challenge: data management and sharing
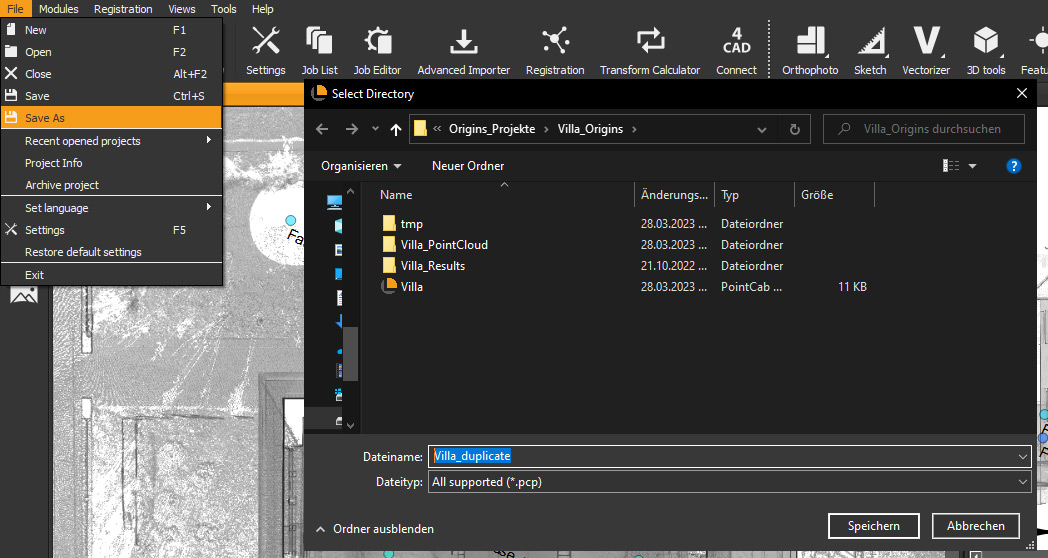
Another major issue was the size of the datasets.
The generated point clouds were large and difficult to share. Standard methods such as email or common file-sharing services quickly reached their limits (for example, 2 GB file size restrictions), which meant that external hard drives were sometimes used instead.
This exposes a key challenge in collaborative workflows:
The value of the data can only be realized if it is easily accessible – and if the necessary hardware is available.
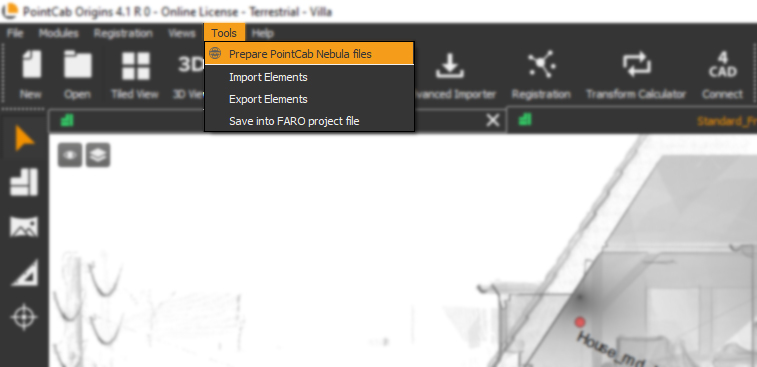
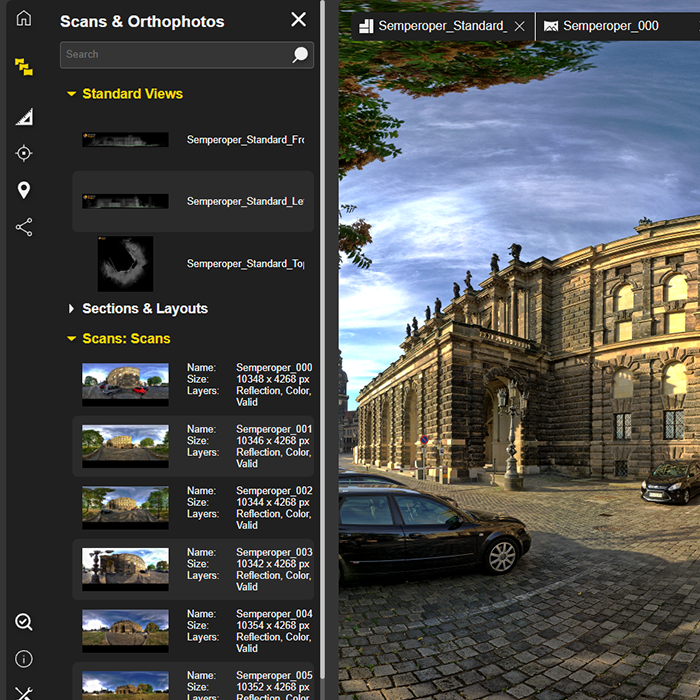
This is where cloud-based solutions like PointCab Nebula offer a much more efficient approach. Projects can be hosted, visualized, and shared directly within the user’s own cloud environment, therefore eliminating the need for complex file transfers.
Between expectations and reality: a steep learning curve
The initial expectation of producing complete as-built drawings within a short timeframe proved to be unrealistic.
Instead, the project evolved into an iterative process: scanning, correcting, reprocessing, and redrawing. Yet this is precisely where its real value lies.
The students not only learned the workflow itself, but also gained a clear understanding of where typical issues arise, and how to avoid them in future projects.
Key takeaways included:
- improved scan planning
- better handling and securing of reference targets
- more efficient use of software tools
- a more realistic assessment of data sizes and hardware requirements
Conclusion: technology meets learning

This project clearly demonstrates the potential of digital building surveying.
As Nicolas Wild puts it:
“Although terrestrial laser scanning originated in landscape surveying, the method can be effectively applied to construction measurement: It provides a complete geometric capture of the existing structure and, compared to manual measurement, opens up additional analysis options in the planning process. The initial investment in scanners and software may seem like a hurdle, but it will pay off as experience grows and more projects are completed.”
At the same time, it becomes evident that success depends not only on the technology but on understanding the workflow behind it.
With the experience gained from this project, the students are far better prepared for future work. Once this initial learning phase is complete, workflows become significantly more efficient, and the true strengths of laser scanning can fully unfold.
Our recommendation for getting started
Many of the challenges encountered in this project can be significantly reduced by understanding the software from the outset.
That’s why we recommend:
- free demos to explore the full capabilities of PointCab Origins
- contact our dedicated support to avoid common pitfalls early on
- and cloud-based solutions like PointCab Nebula to simplify data sharing and project collaboration
This turns a complex entry into a much more structured workflow–and allows the full potential of laser scanning to be realized.

project participants
Students:
Celina Harzer, David Knopp, Maximilian Krahn, Edgar Landl, Witta Majorov, Nicolas Wild
Professor:
Prof. Stephan Jost
Advisor:
Mika Kramer
Other publications:
Nicolas Wild – Büro Stefan Wild Architekt Montabaur
Sources & further information:
– Koblenz University of Applied Sciences
– Welterbe Limes Bendorf-Sayn
Want to keep up with the latest pointCab news?
Then follow us on Social Media or subcribe to our newsletter!