World Nature Conservation Day – How Laser Scanning Supports a More Sustainable Future

blank

The Architecture, Engineering, and Construction (AEC) industry stands at the forefront of shaping our built environment. In our series “The AEC Impact” we explore the myriad ways in which the industry contributes to societal well-being, environmental sustainability, and economic growth. Join us as we uncover the transformative power of the AEC industry and its pivotal role in building a brighter, more sustainable world.

How Laser Scanning Supports Conservation

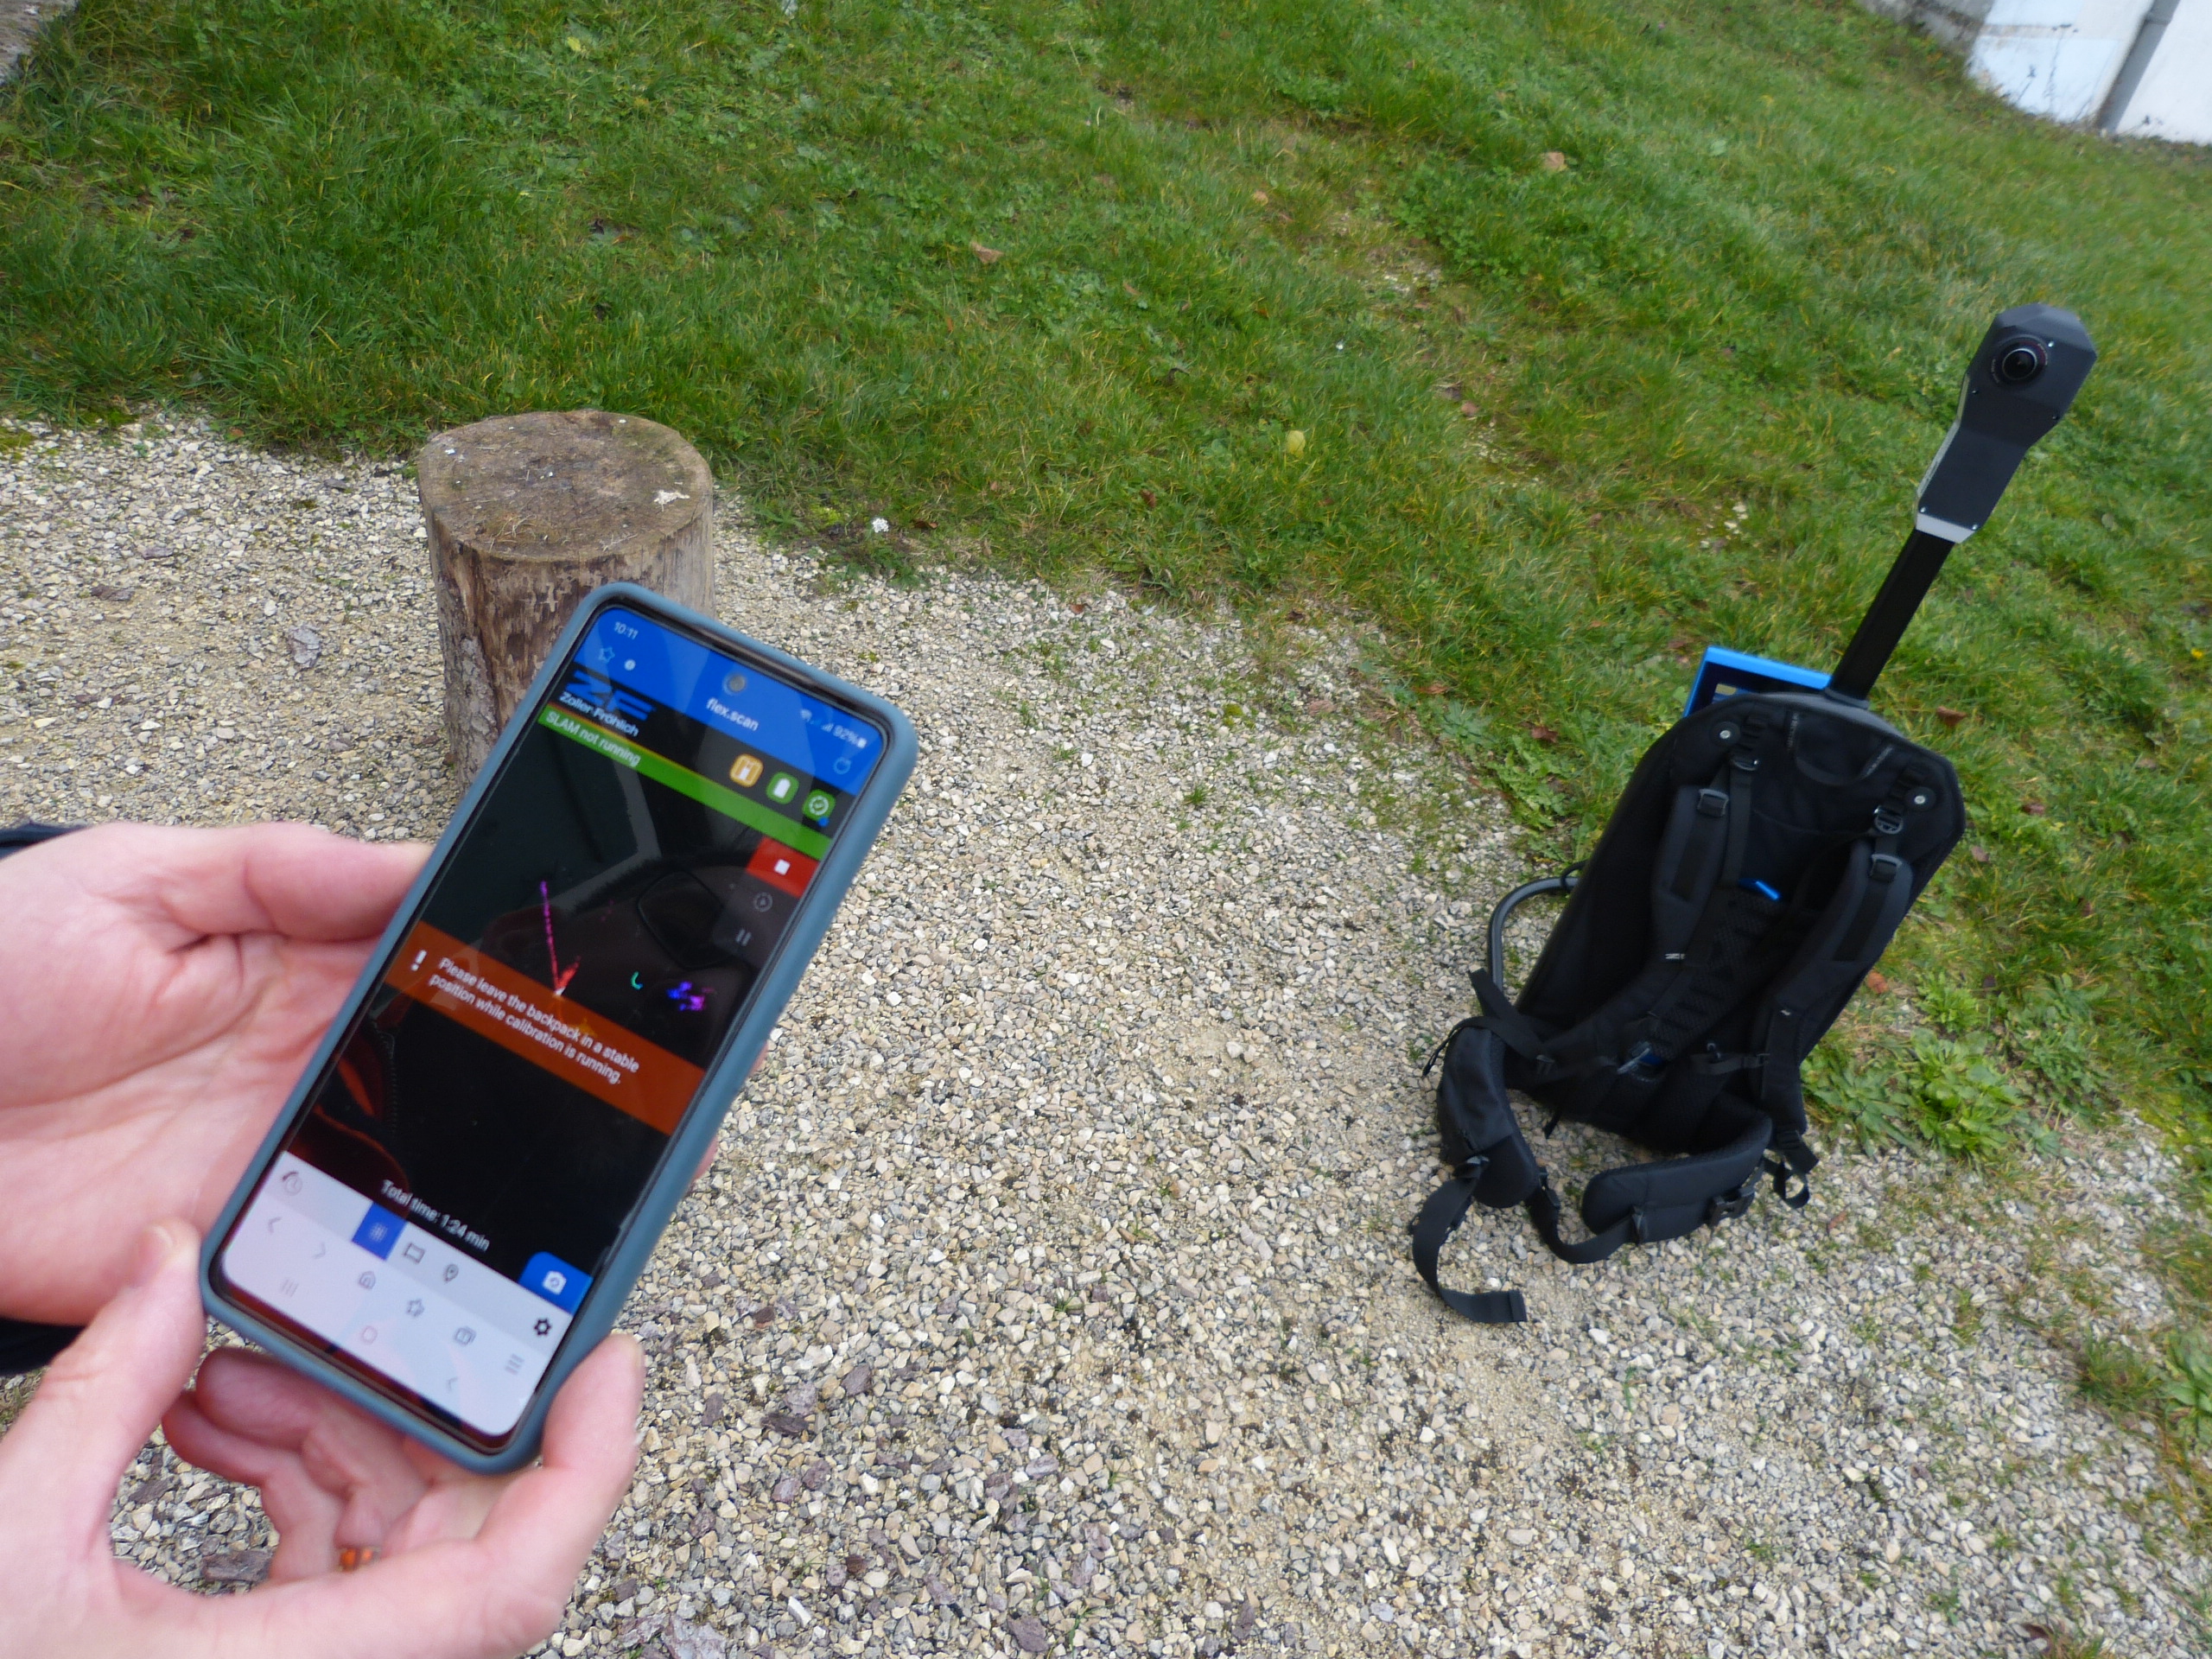
From remote rainforests to urban green spaces, laser scanning technology helps researchers and organizations in many different ways:

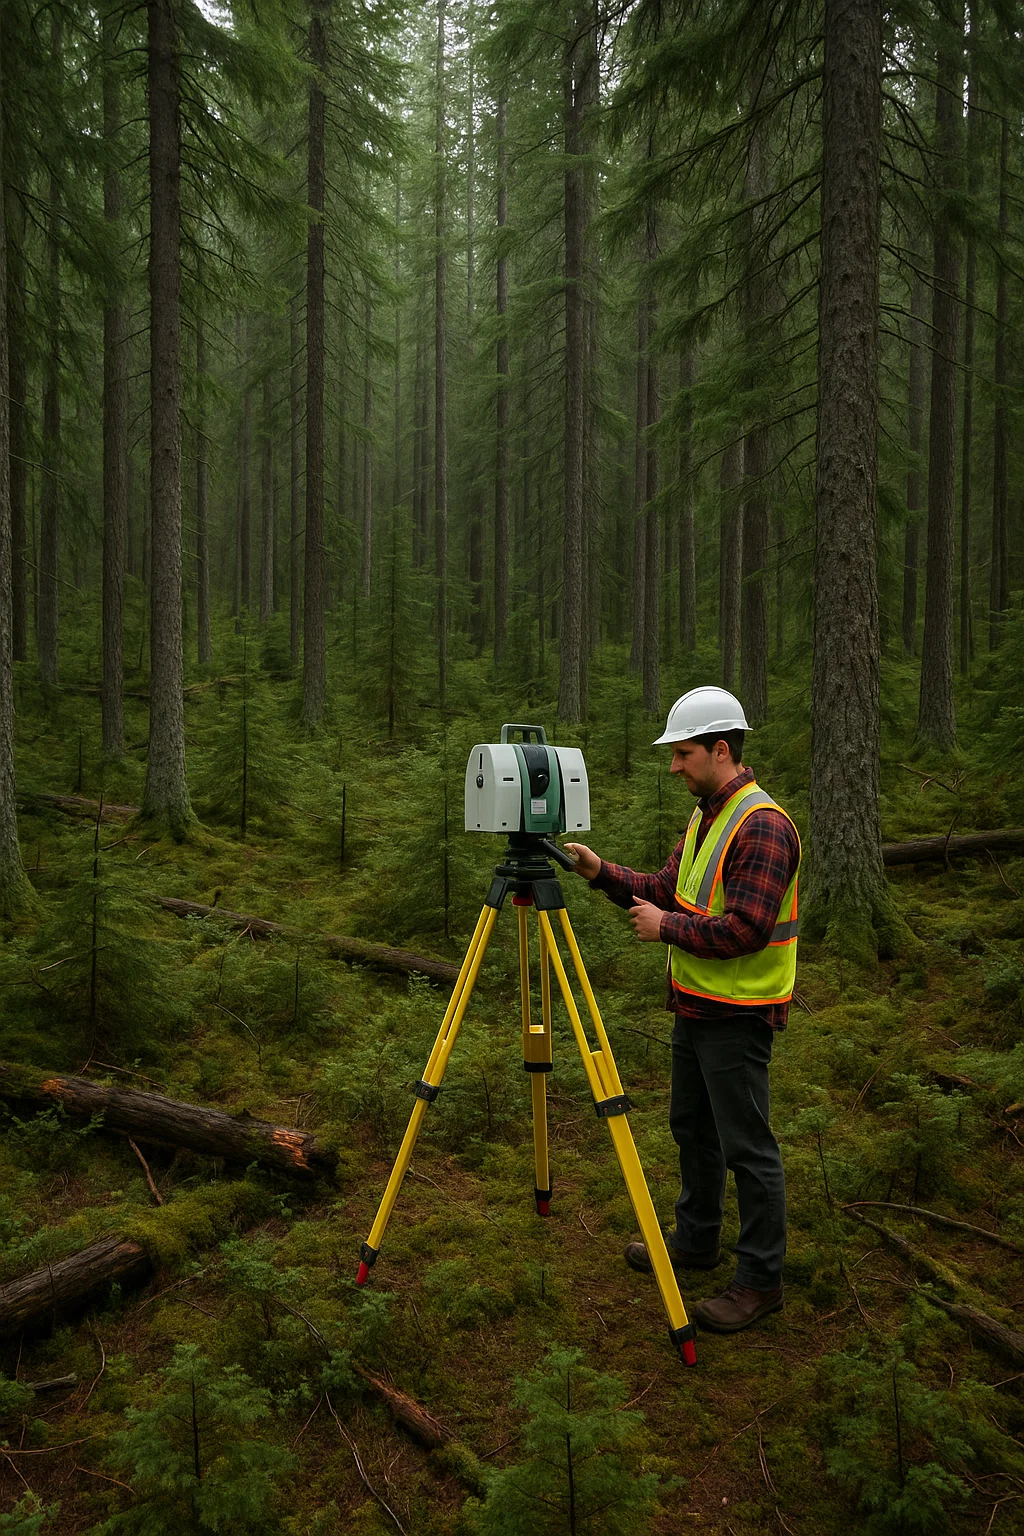
  • Monitor forest health and deforestation
    → High-resolution scans can detect subtle changes in vegetation over time.

  • Create digital twins of natural landmarks
    → This helps preserve vulnerable ecosystems and supports restoration after natural disasters.

  • Track erosion and water levels in riverbanks and coastal zones
    → Accurate 3D models allow experts to assess risks and plan interventions.

  • Document caves, cliffs, and fragile habitats without physical contact
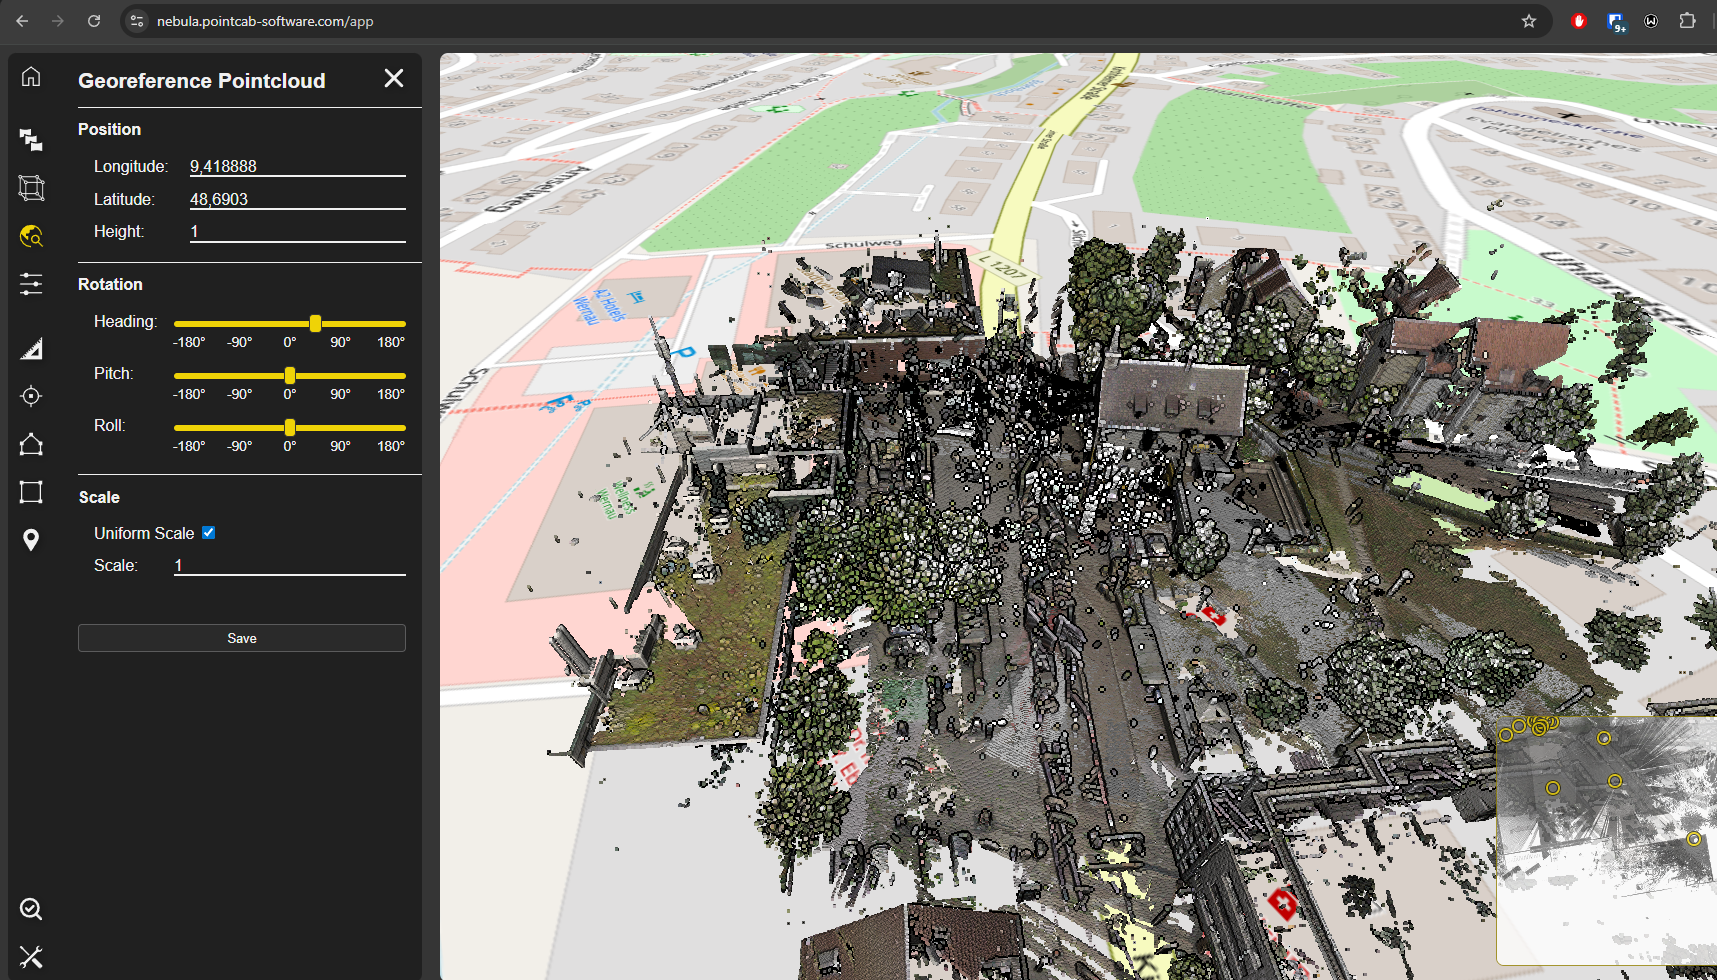
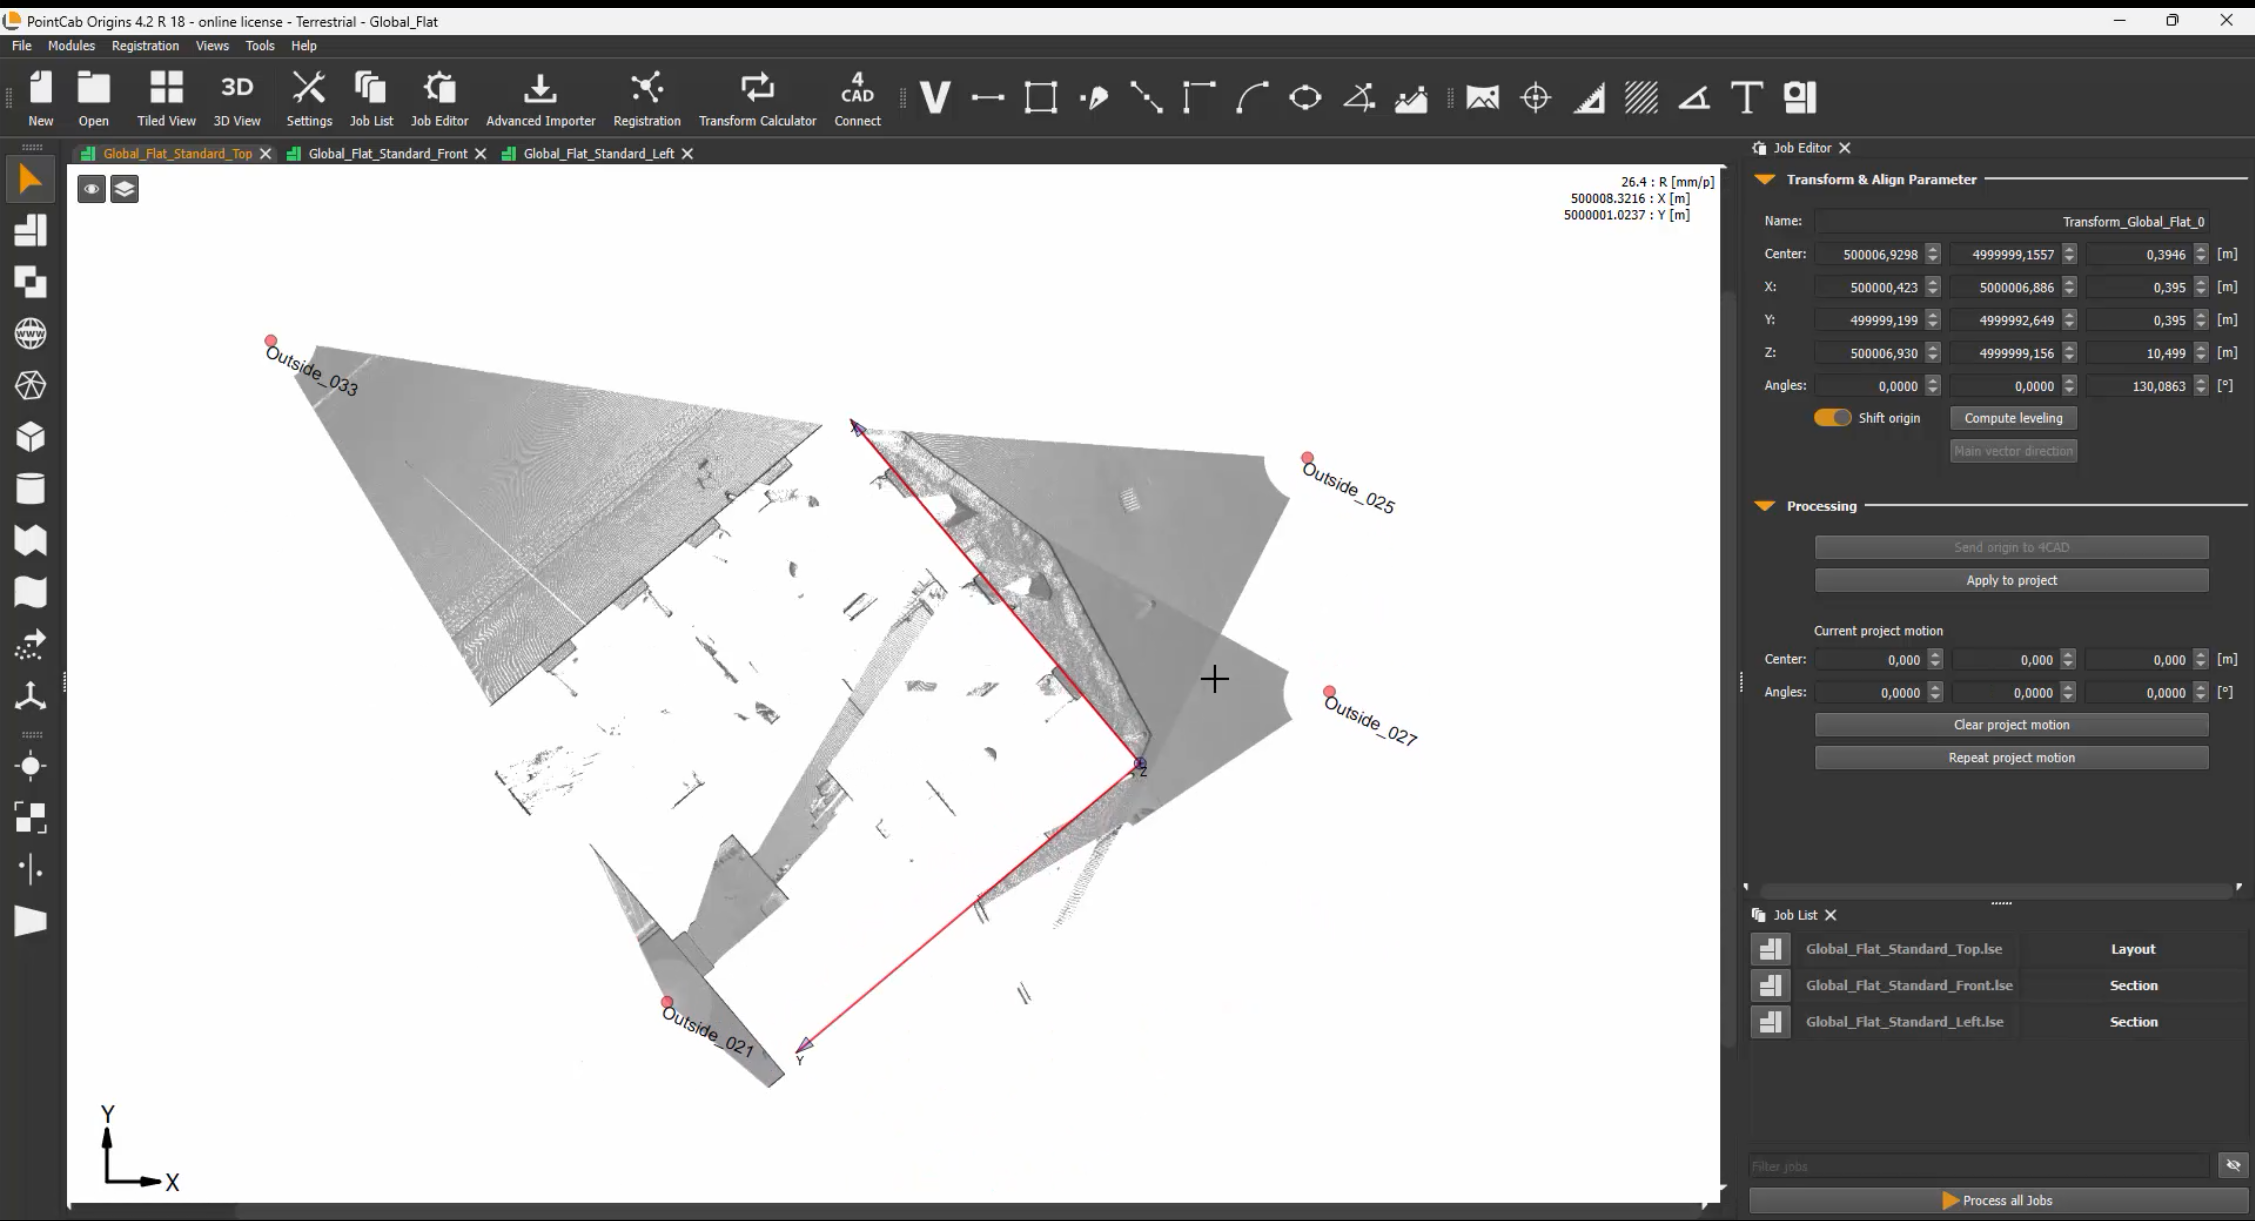
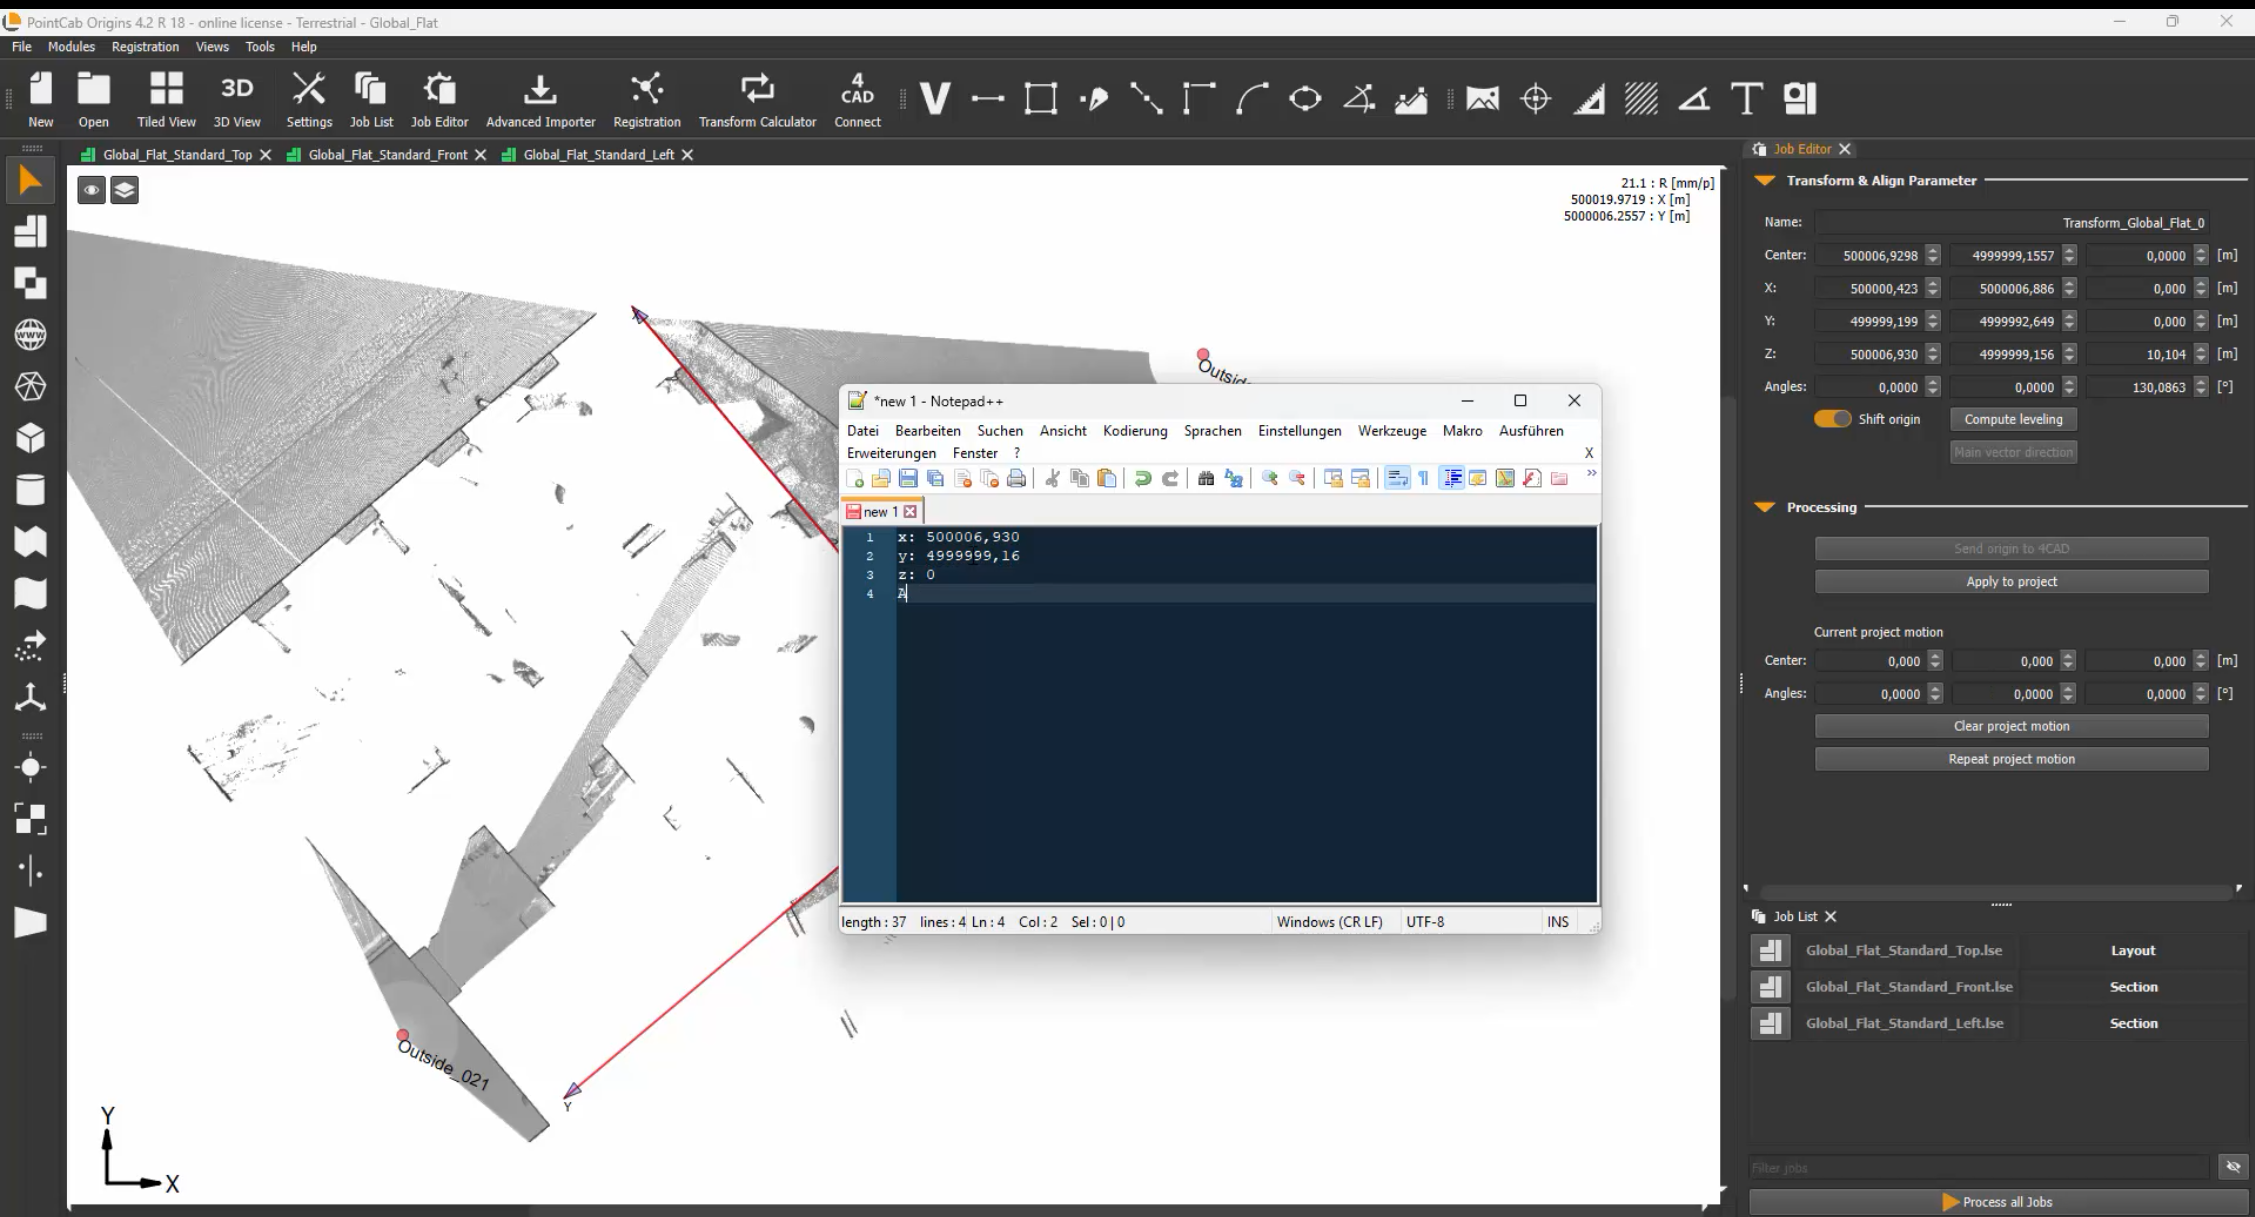
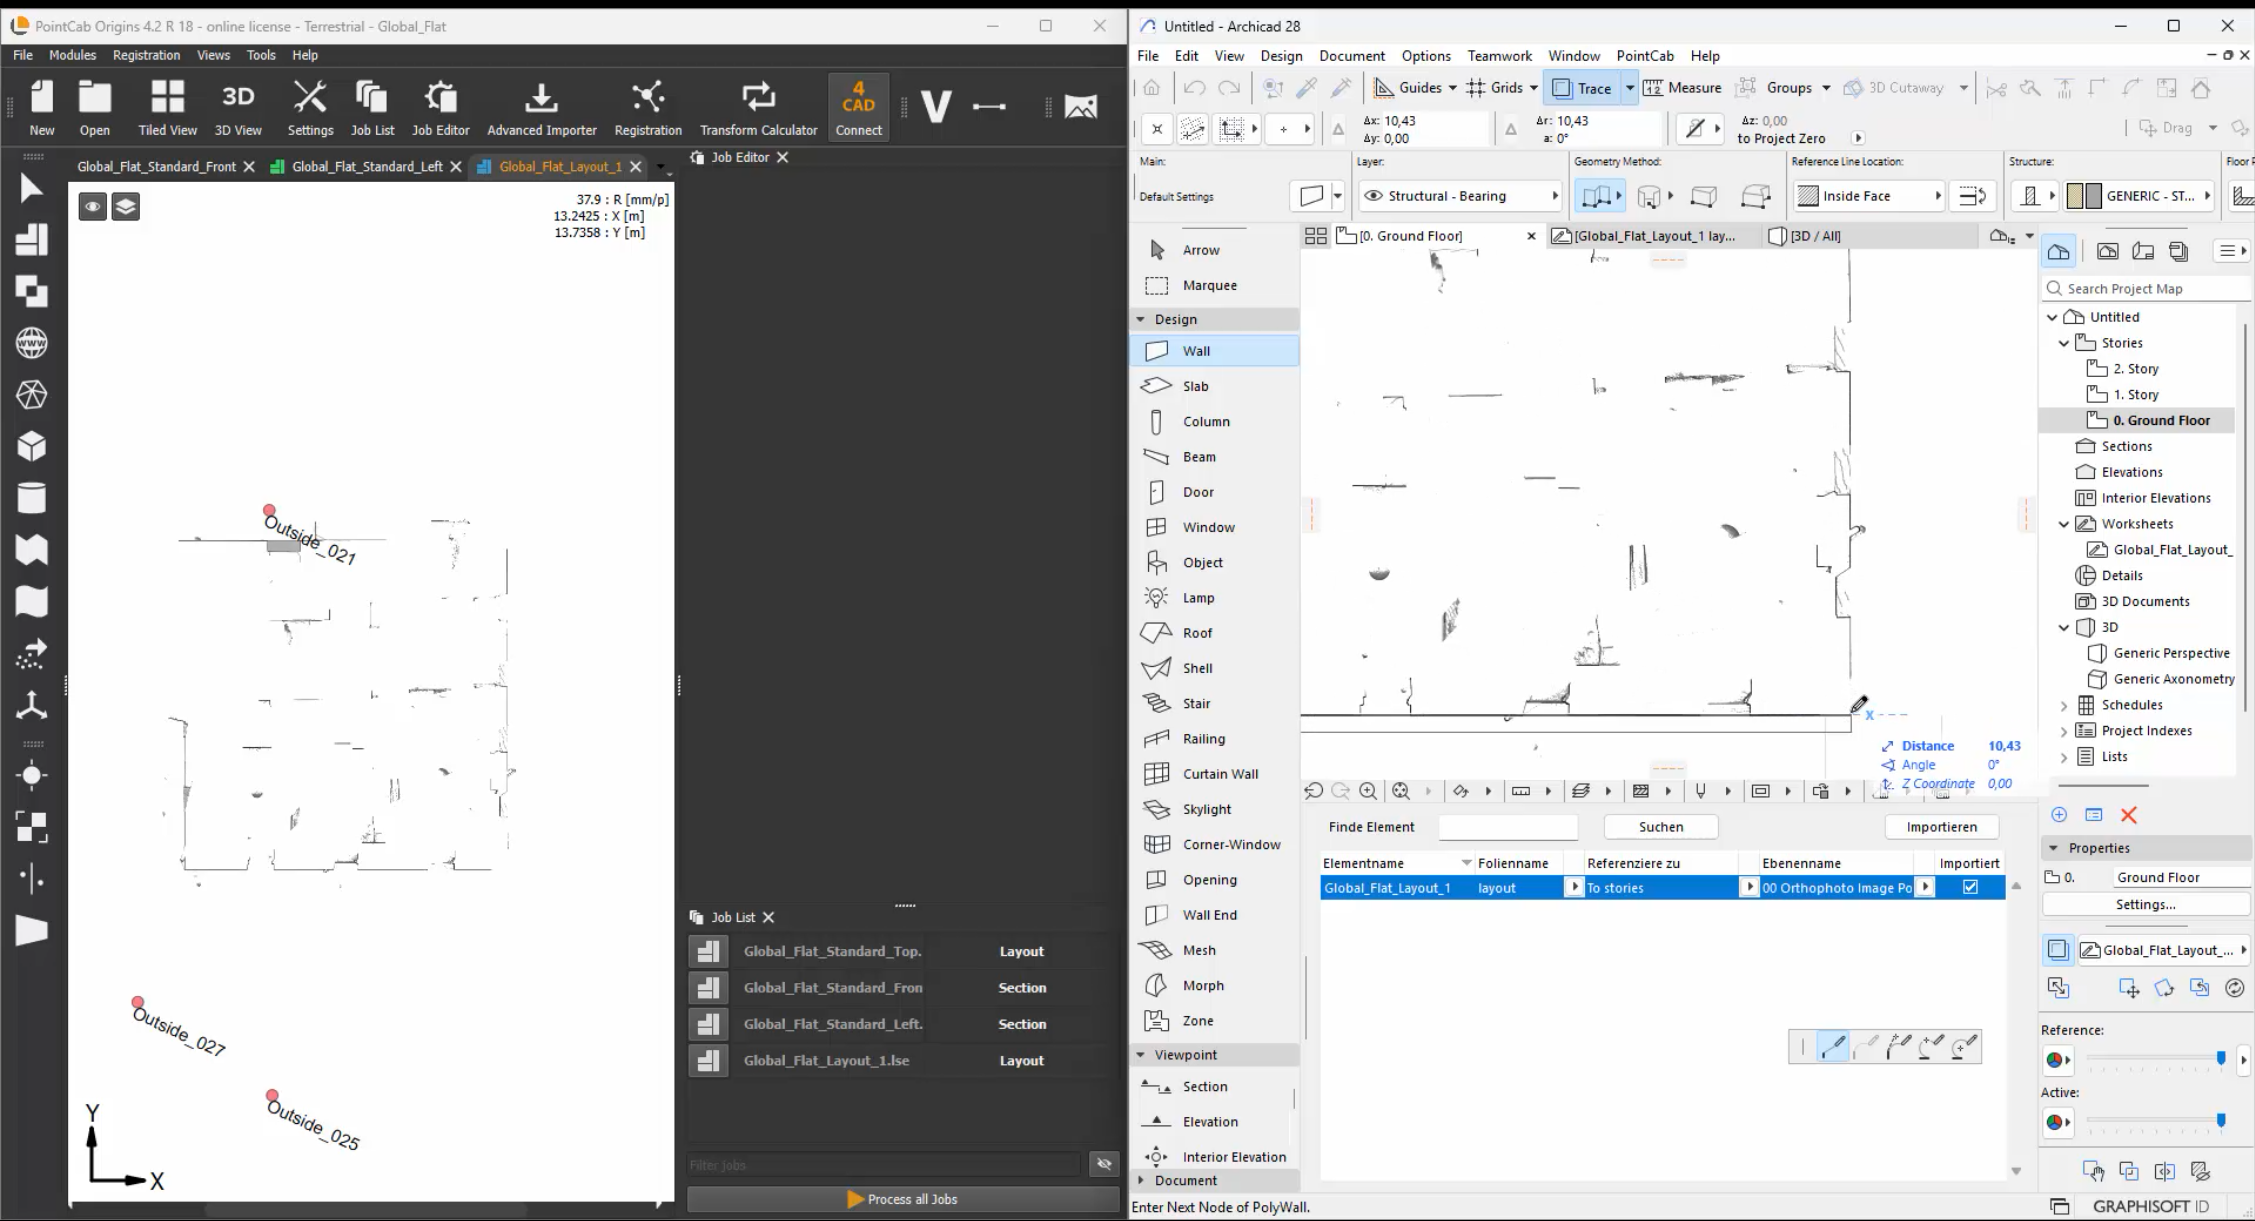
    → Non-invasive scanning helps protect areas where human presence might cause damage.

  • Giving Old Buildings a Greener Future
    → Scanning existing buildings helps to restore them in an energy-efficient way, also saving precious resources by not building new structures

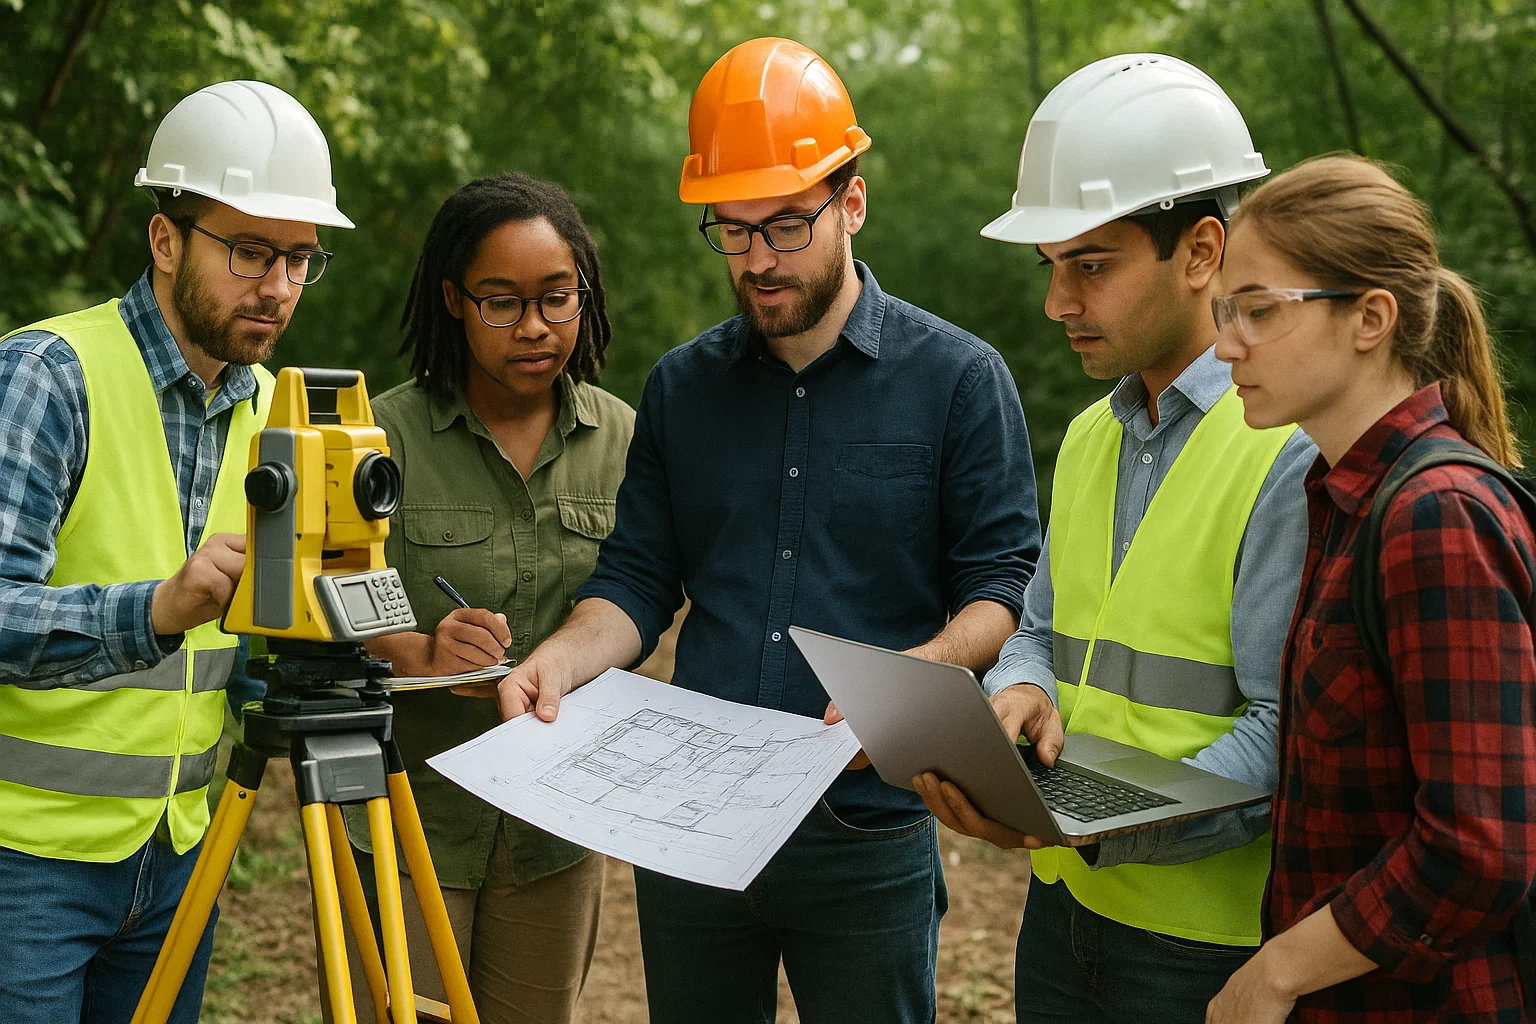
These projects often involve interdisciplinary teams: ecologists, engineers, architects, and geospatial experts working together. 

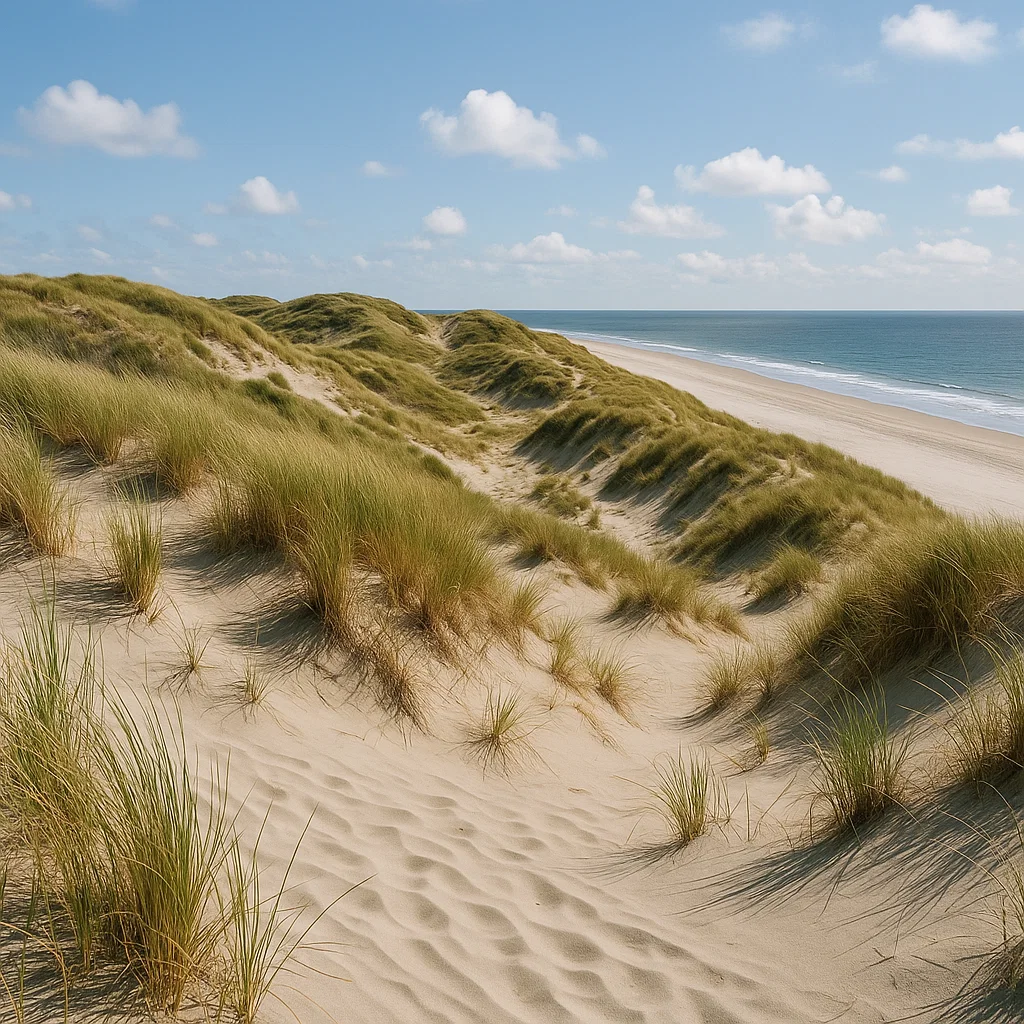
Real-life examples: Protecting Dune Ecosystems in the Netherlands

In the coastal dunes of Vlieland, an island in the Dutch Wadden Sea, researchers used LiDAR combined with aerial imagery to map the spread of invasive shrubs like Prunus serotina and Rosa rugosa. These species threaten native dune biodiversity, but detecting them manually across large, shifting landscapes is difficult and resource-intensive.

By incorporating LiDAR-derived canopy height data into their analysis, the team improved their detection accuracy by more than 10%, enabling more targeted removal and less environmental disturbance.

“The use of LiDAR improved classification of shrub cover substantially, especially in detecting higher-density patches.”
Van Iersel et al., Remote Sensing in Ecology and Conservation (2020)
🔗 Full Report (Open Access)

This approach helps preserve native dune flora and fauna while reducing the need for broad mechanical or chemical interventions.

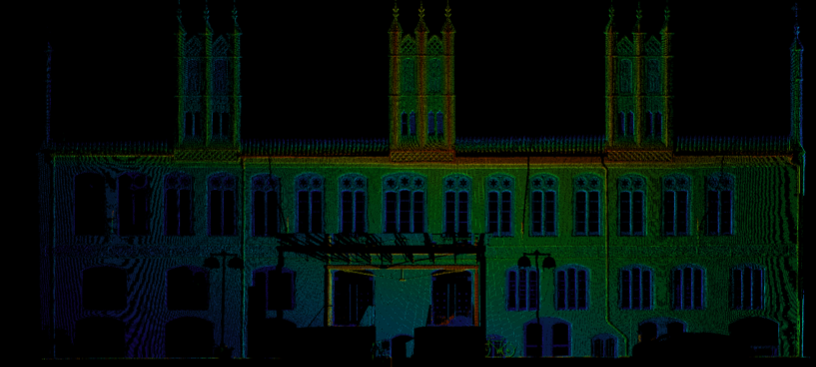
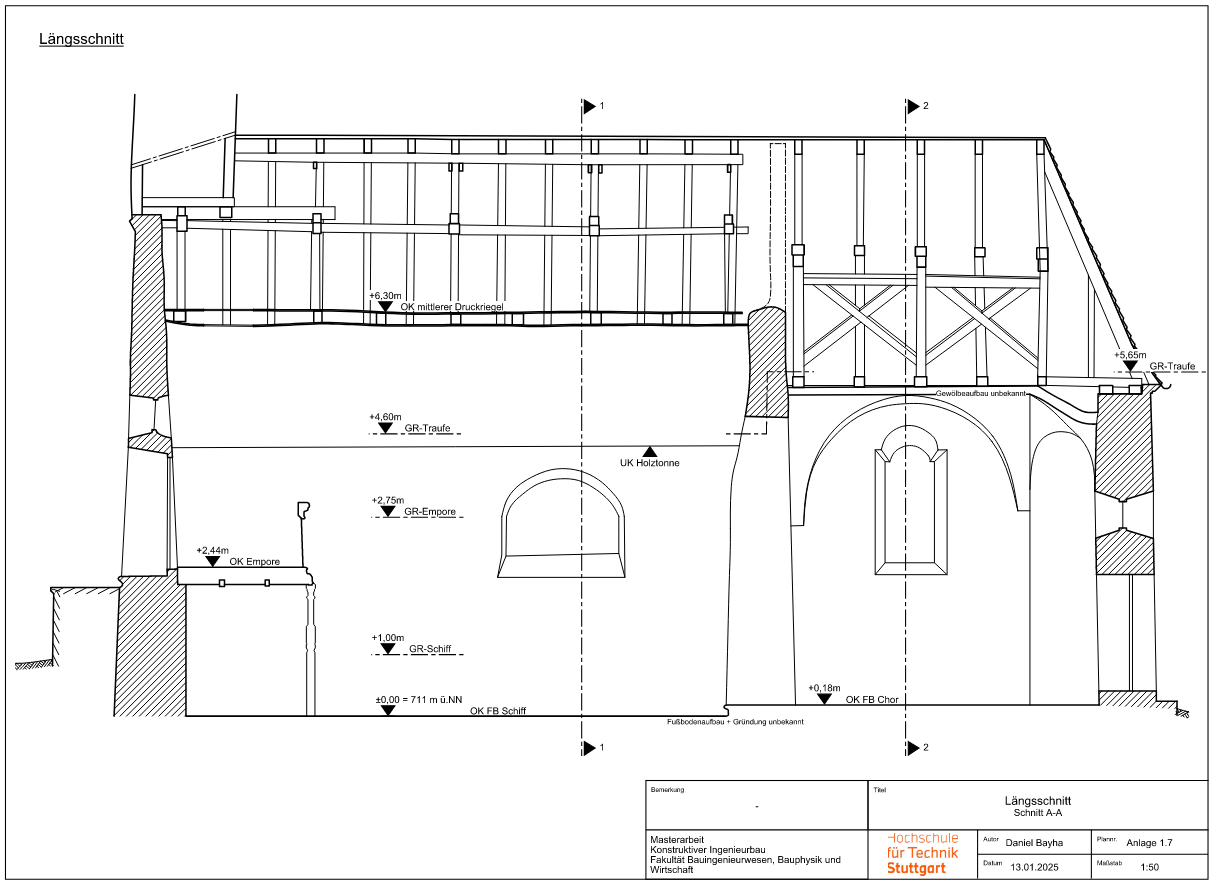
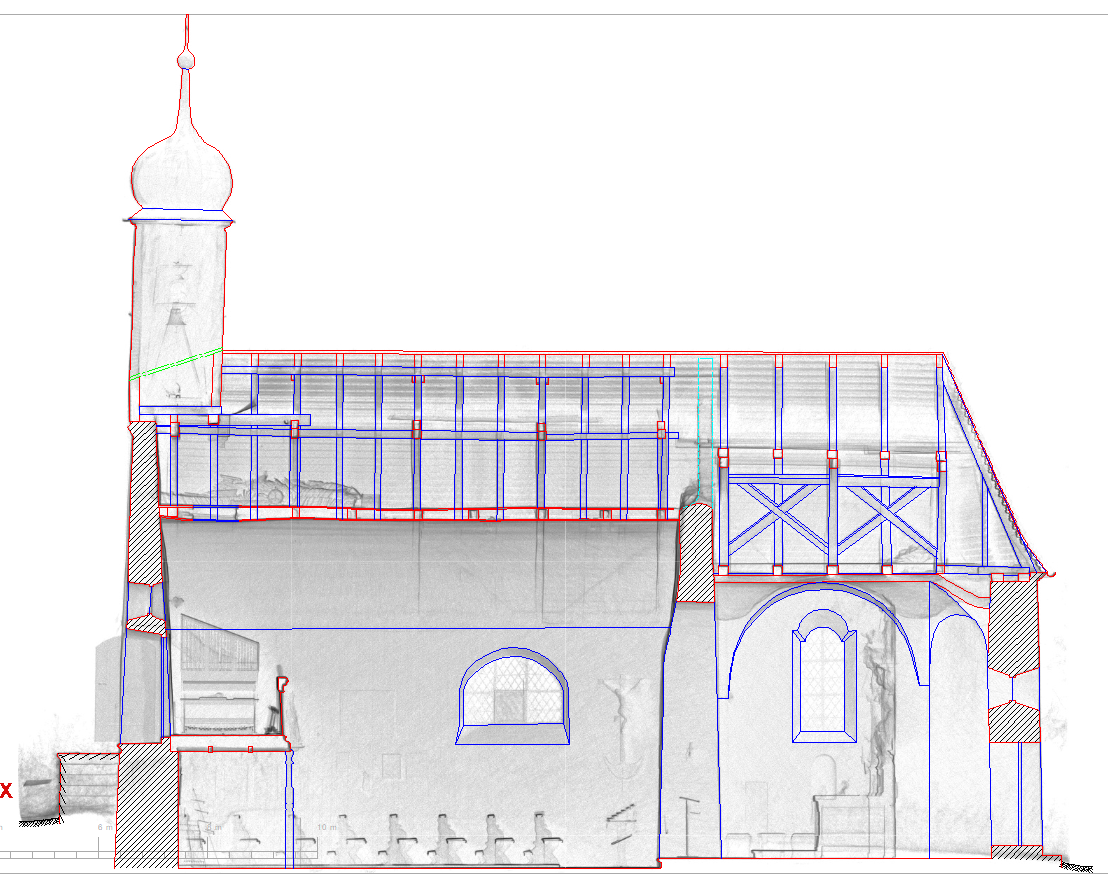
Real-life Examples: Scottish National Portrait Gallery

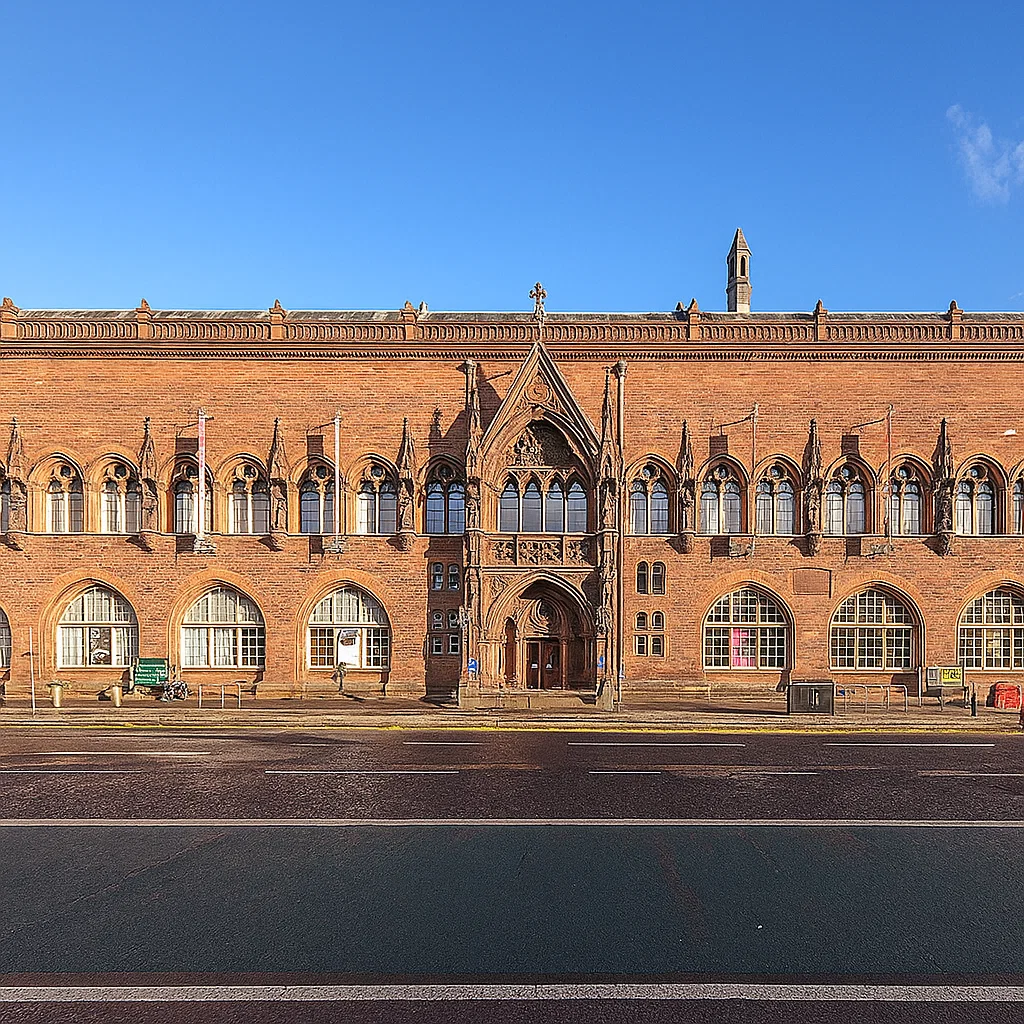
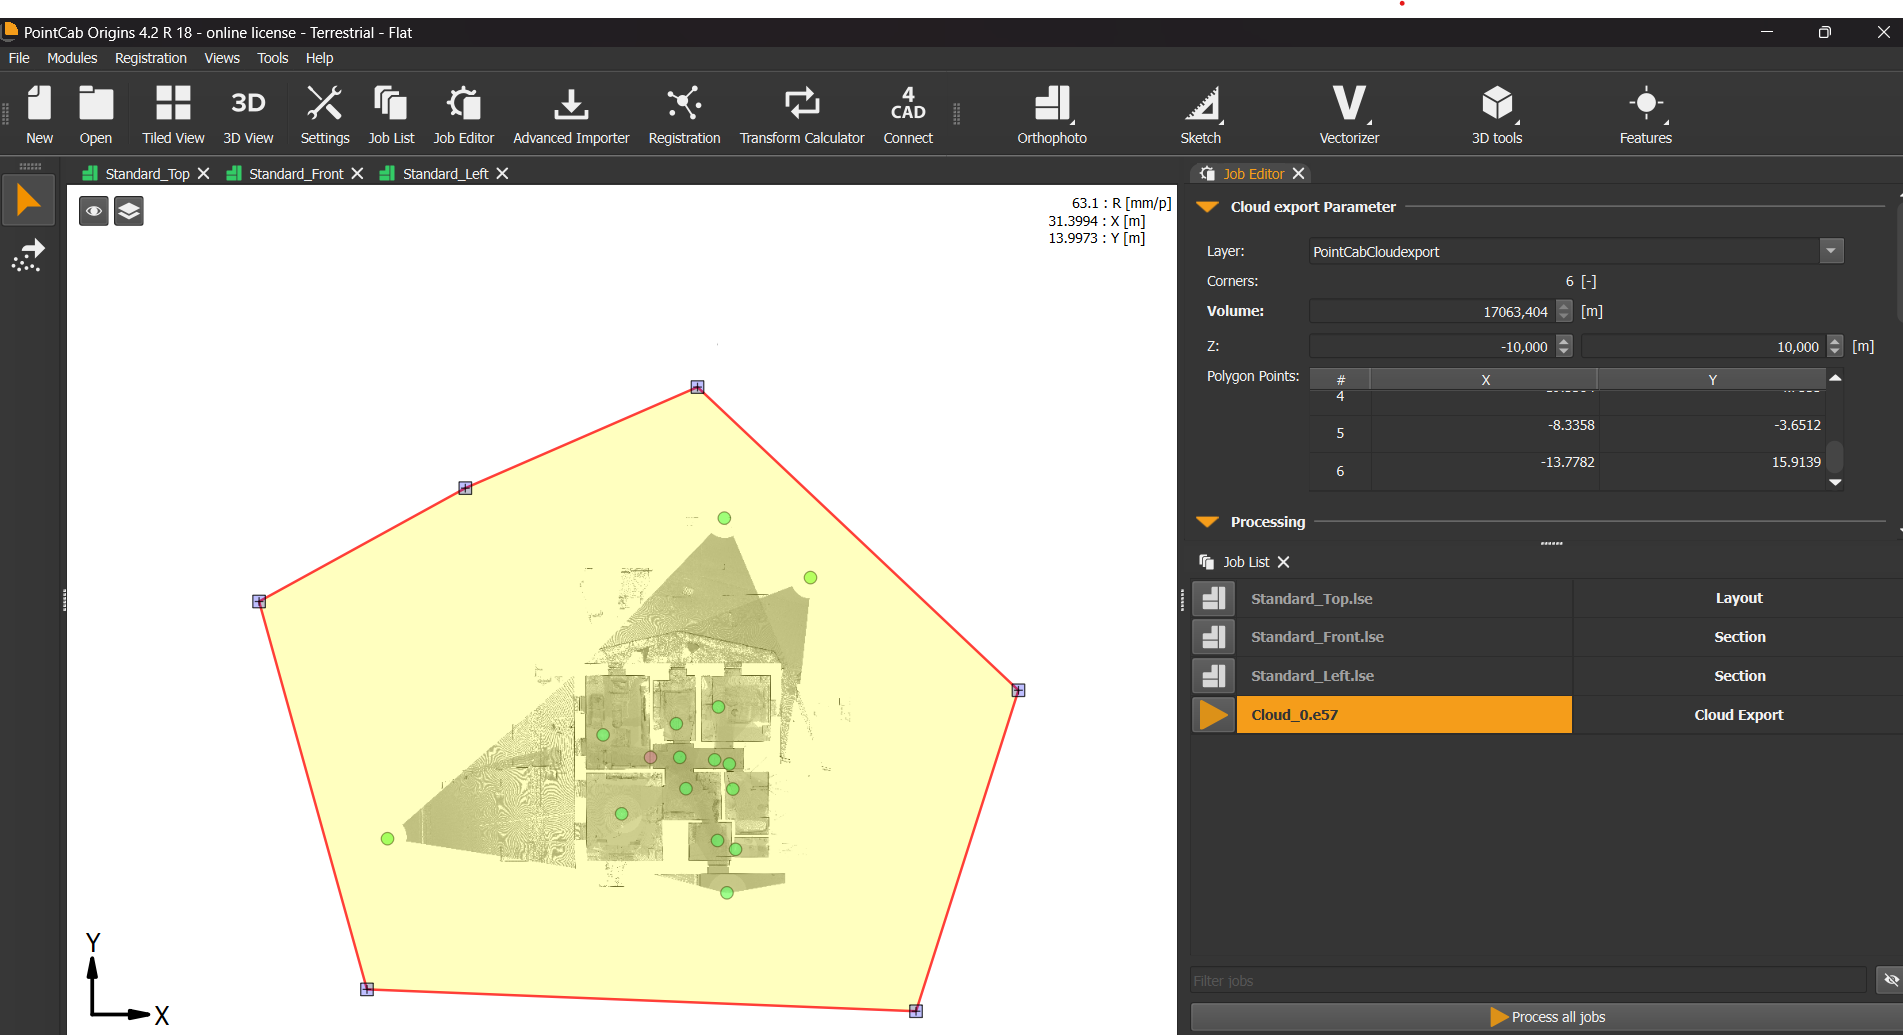
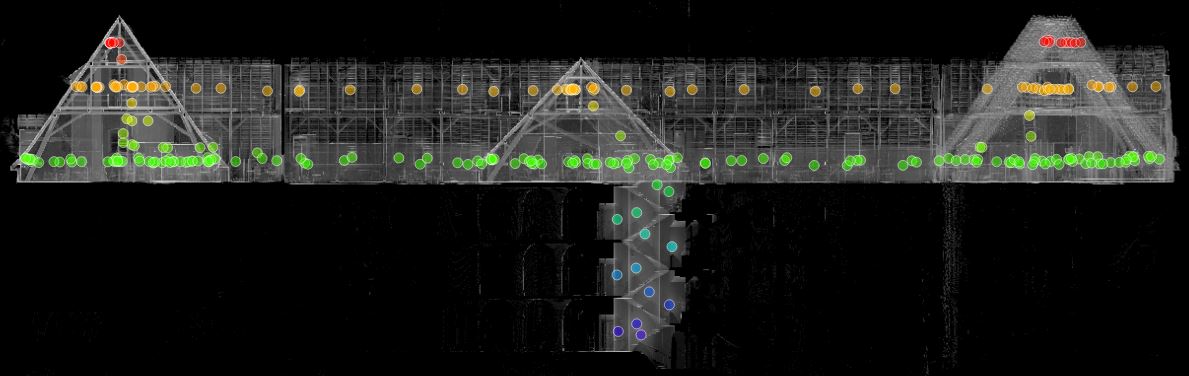
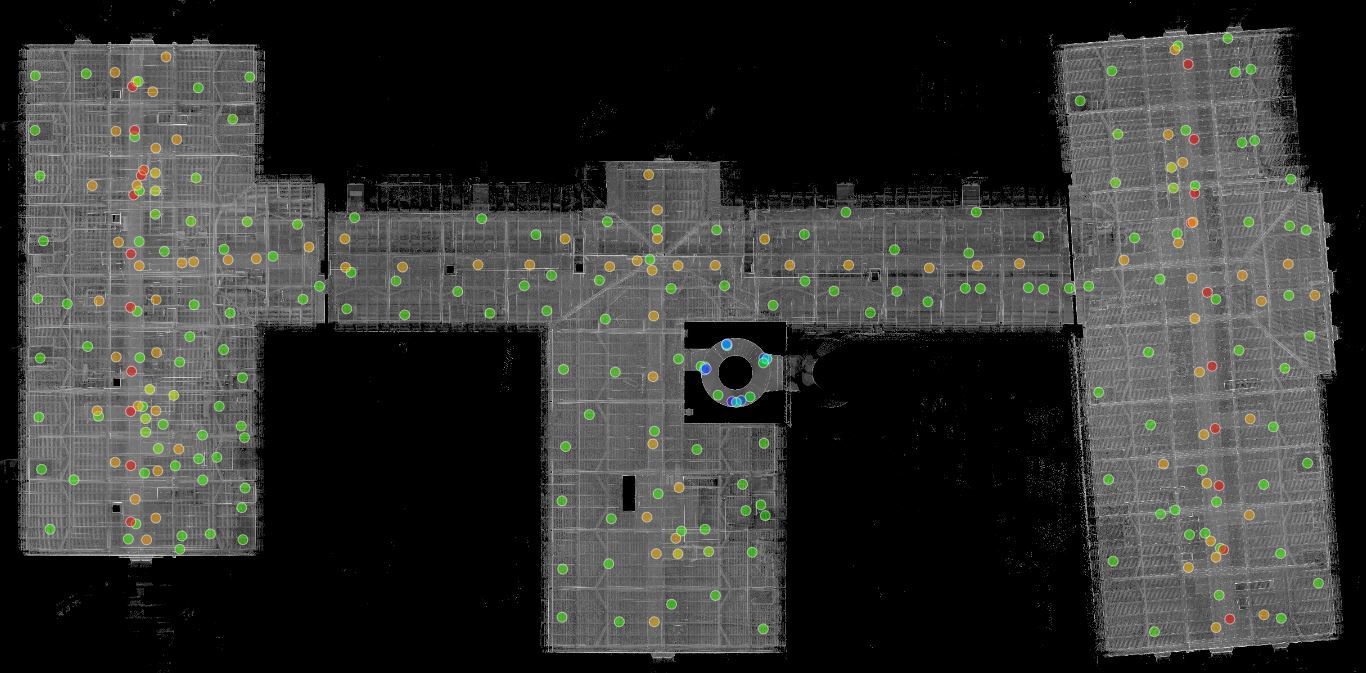
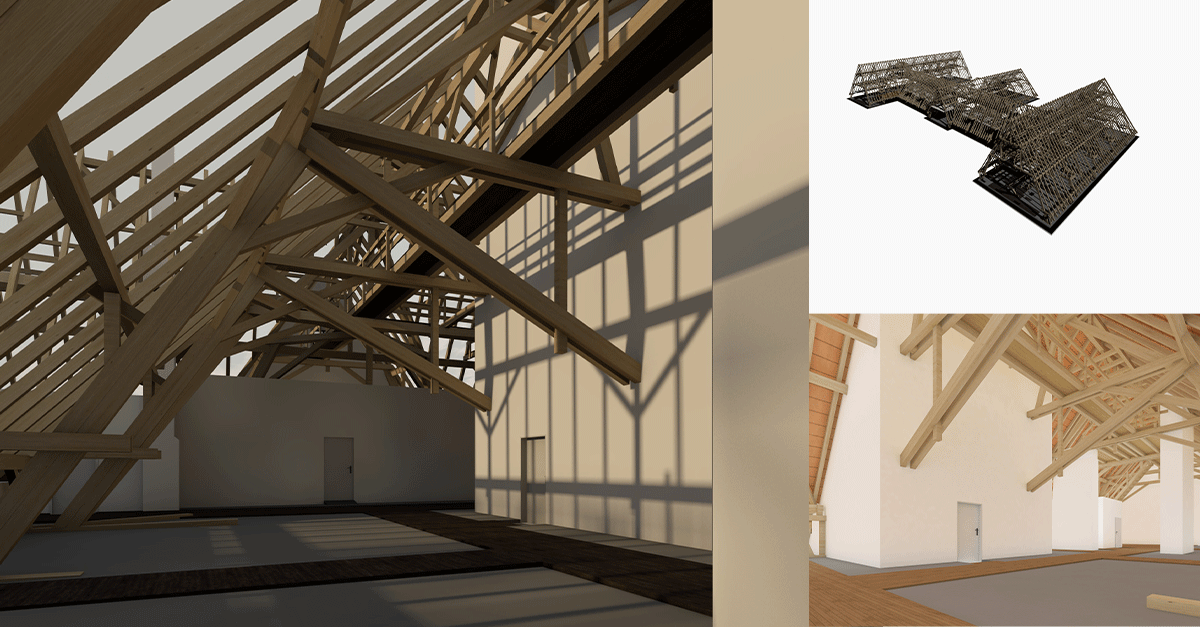
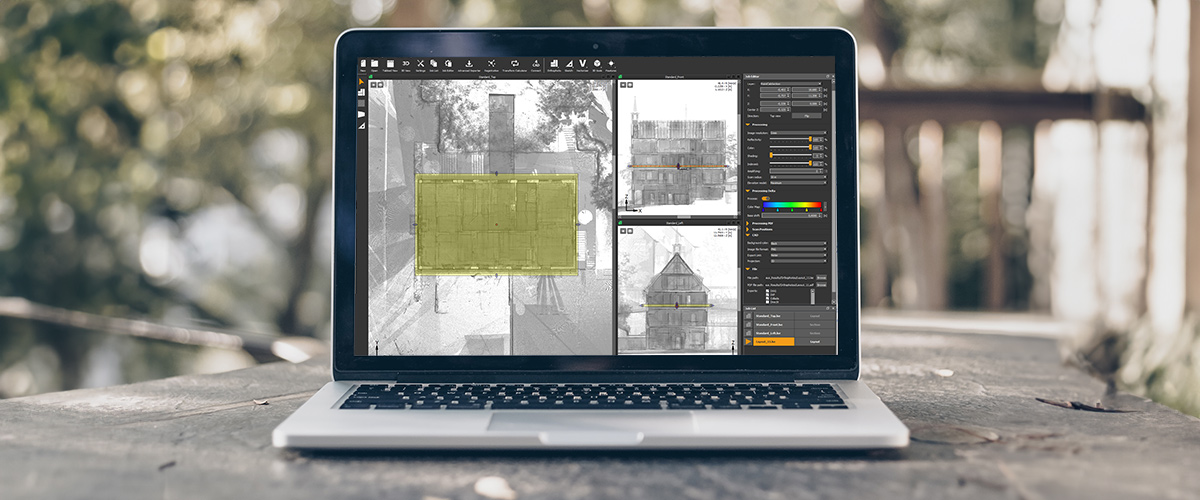
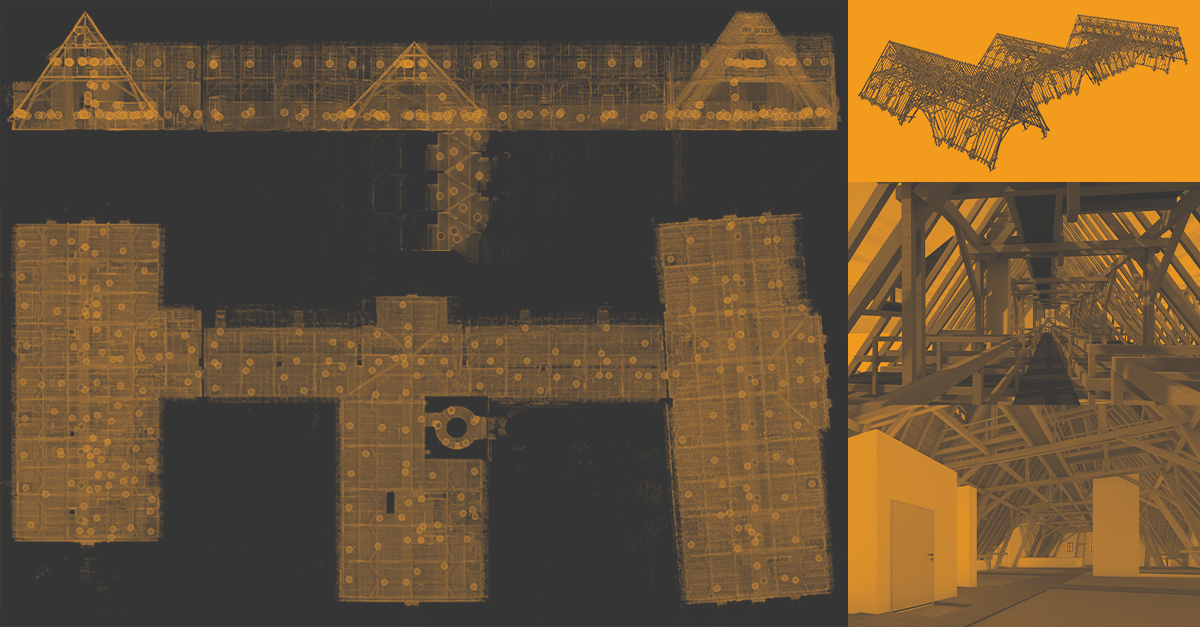
In the Scottish National Portrait Gallery, Edinburgh 3D laser scanning captured the entire structure of the historic building in precise detail. Then a BIM model was created, helping to plan renovations without damaging original features. It also enabled detailed analysis of thermal bridging, structural conditions, and spatial coordination for new systems. This lead to:

  • Improved insulation and air tightness without compromising heritage elements
  • Integration of energy-efficient lighting and HVAC systems
  • Achieved a 14% reduction in annual CO₂ emissions, contributing to overall better energy performance while maintaining historical integrity

Laser scanning was essential in balancing heritage preservation with modern energy standards.

 🔗 Learn more here or here

Honoring the People Behind the Scans

These successes weren’t born from gadgets alone. They reflect the dedication of surveyors, ecologists, engineers, architects, and technicians. Their expertise ensures technology serves both people and nature. 

On World Nature Conservation Day, their quiet yet crucial contributions deserve our deepest gratitude.

Want to keep up with the latest pointCab news?

Then follow us on Social Media or subcribe to our newsletter!

How to Work with Georeferenced Point Clouds in Archicad

blank

Real-world support cases explained – one point cloud at a time.

In this series, we take a closer look at real questions and challenges that come up when working with point cloud data. Each post is based on an actual support case and breaks down what happened, why it happened, and how to solve it, step by step.

But we don’t stop at troubleshooting. Along the way, we explain the background behind the tools, terms, and technologies involved.

The Questions that sparked this Post

A user asked us a great question:

Is there a way to reverse the transformation applied to a project in Origins, especially if I want to maintain georeferencing for modeling in Archicad?

She mentioned seeing a “trick” referenced in one of our webinars, but couldn’t find it again. Since this topic comes up regularly – especially with BIM workflows – here’s a detailed guide for anyone modeling in Archicad with georeferenced point clouds.

What Is Georeferencing – And Why It Matters in Archicad

Before diving straight into our solution, a little background info on georeferencing might be in order:

Georeferencing is the process of aligning spatial data (like point clouds) with real-world geographic coordinates, such as UTM or Gauß-Krüger systems. When a point cloud is georeferenced, every data point corresponds to a precise location on Earth. This is critical in AEC workflows for aligning scan data with GIS, survey data, or construction site coordinates.

In theory, this georeferenced data should integrate seamlessly into CAD or BIM software. But in practice, large coordinate values (often in the millions) can break things.

The Challenge: Large Coordinates vs. Modeling Performance

Point clouds in georeferenced coordinate systems often contain large values far from the origin (0,0,0). CAD tools like Archicad and Revit don’t handle these large coordinates gracefully. This can lead to:

  • Laggy or unresponsive modeling
  • Display glitches
  • Broken geometry or snapping issues
  • Inaccurate scaling or alignment

So how do you preserve georeferencing and maintain smooth modeling in Archicad?

The "Trick": Temporary Translation Instead of Permanent Transformation

Here’s how to maintain georeferencing while still working in a performant local coordinate system:

1. Avoid Full Alignment with Rotation
When transforming your project in Origins, don’t use full rotation/alignment unless absolutely necessary. Instead, use the Align Tool to apply a translation – a shift in position and rotation around the Z-axis. The rotations around the X and Y axes should be avoided. Enter these parameters as the Survey Point in Archicad. 

Pro tip: Use round, memorable shift values.
Example: If the original X coordinate is 3,500,357.000, shift it to 0 or another clean number to simplify your local modeling.

2. Document the Shift

PointCab Origins automatically stores transformation values in the Align Protocol. Take a screenshot or note the exact shift values, so you can later reverse the transformation. These values will be crucial when re-georeferencing the model.

3. Model in Archicad Locally
Now that your point cloud is positioned near the origin, you can safely and efficiently model in Archicad. Performance improves, and modeling tools behave as expected – without distortion caused by large coordinates.

4. Re-Apply Georeferencing for Export
After modeling, reverse the initial translation.
This brings your model back to its true georeferenced location, ensuring your IFC, DWG, or BCF exports are correctly aligned in the real world

Bonus Tip: Forgot Your Transformation Settings?

No worries. Origins allows you to:

  • Create an Align transformation but not apply it right away. This shows you what changes would be made — which you can then reverse.


  • Alternatively, applying the same transformation twice can sometimes restore the original state (especially for pure translations).

Want to keep up with the latest pointCab news?

Then follow us on Social Media or subcribe to our newsletter!

Summer Sale 2025

blank
blank

PointCab Summer Sale 2025

Your chance to save 20%

blank

Summer Sale at a Glace

From August 1st to August 15th, you can save 20% on almost all PointCab products.

Just use the code Summer_Sale_2025 when shopping in our online shop!

What you need to know

➡️Get 20% off PointCab products with the code: Summer_Sale_2025

➡️Only redeemable between August 1st and 15th (CEST)

➡️Only redeemable in the PointCab Online Shop

Not applicable for Maintenance & Support Packages

Not applicable for Academic Licenses

Questions? Our team is happy to advise you.

blank

How to redeem the voucher code

Step 1: Visit our Online Shop and add products of your choice

Step 2:  Got to basket

Step 3: Select “Redeem promotional coupon” under “Order overview” and enter the coupon code: Summer_Sale_2025

Step 4: Click “Redeem coupon” and proceed to check out

Want to keep up with the latest pointCab news?

Then follow us on Social Media or subcribe to our newsletter!

Update PointCab Plugins: New interface, improved workflow

blank

CAD PLUGIN UPDATES

4autocad, 4Brics and 4ZWCAD

blank

We’ve completely revamped our PointCab CAD plugins – 4AutoCAD, 4Brics, and 4ZWCAD.
With the latest update, all three plugins now feature a brand-new transfer interface that makes working with point cloud data significantly more efficient, intuitive, and user-friendly.

VIDEO: A LOOK INTO THE NEW FEATURES

Using the 4AutoCAD plugin as an example, we’ll showcase the most important new and improved features.
The workflows demonstrated apply similarly to 4Brics and 4ZWCAD.

What’s new:

GENERAL IMPROVEMENTS

Want to keep up with the latest pointCab news?

Then follow us on Social Media or subcribe to our newsletter!

One Scan, 900 Files?!

blank

Real-world support cases explained – one point cloud at a time.

In this series, we take a closer look at real questions and challenges that come up when working with point cloud data. Each post is based on an actual support case and breaks down what happened, why it happened, and how to solve it, step by step.

But we don’t stop at troubleshooting. Along the way, we explain the background behind the tools, terms, and technologies involved.

The Question That Sparked This Post

“I imported just one scan… why do I have over 900 files now?”

If that sounds familiar, you’re not alone, and no, PointCab isn’t secretly duplicating your data. This exact situation came up in a recent support case, and it gave us the perfect opportunity to explain what’s really going on behind the scenes.

Our customer imported a single E57 scan exported from Riegl’s RiSCANpro into PointCab Origins. The result:

  • Over 900 .lsd files created
  • More than 700 tiles visible in the Top View
  • And this was just one scan from a 30-scan project

The scan didn’t seem huge, so where did all those files come from? Let’s just say: it’s not a bug – it’s a feature. And a smart one at that.

The Key Context: Structured vs. Unstructured Point Clouds

Before diving into what happened, it helps to understand how point clouds are stored and why that matters when you import them into PointCab Origins.

Structured Point Clouds

  • Come directly from scanners in their native formats
  • Include metadata like scan positions and orientations
  • Organized into scan stations or lines, each with a defined perspective
  • Ideal for clean segmentation and accurate scan-to-scan alignment

Structured Point Clouds

  • Formats like E57, LAS, or LAZ (especially when exported generically)
  • Contain just the point data – no scan position, no segmentation
  • All points are merged into a single cloud, with no “origin story”
  • Often include stray points far outside the area of interest

Unstructured formats are great for software compatibility and flexibility, but they don’t tell the full story. That means software like Origins needs to rebuild structure to make the data usable. We explain this in more detail in our webinar on Structured vs. Unstructured Point Clouds, including why this difference affects file handling and performance.

What Origins Is Actually Doing

Now with this info in mind, let’s get back to the case at hand.

Origins doesn’t just render point clouds – it structures them so you can work with them efficiently.

Here’s what happens during import:

  1. Origins breaks the entire point cloud into a 3D grid of cubes, known as an octree.
  2. Each cube becomes a separate .lsd file, whether it contains thousands of points or just one.
  3. These cubes are the foundation for views like the Top View, Section Views, and more.
  4. If even one point lies far away from the main area, Origins generates all the intermediate cubes between that point and the rest of the data.

It’s kind of like paving a road to a remote cabin. You can’t just teleport there. Every step along the way needs to exist so the full path is usable.

What the User Saw

To understand the issue, we loaded the scan and pressed “B” in the Top View to toggle tile boundaries. The view showed:

  • A scan area stretching around 500 meters wide
  • And approximately 350 meters tall

So while the actual structure being scanned may have been compact, stray points – likely captured by the long-range scanner – extended the dataset much farther. And every bit of that range had to be included in the cube structure.

Is this a Problem and if so, how do I handle this?

Is this a problem? Not really.
Origins  handles large numbers of .lsd files efficiently. Most of them are very small in size, and they don’t slow down performance unless the scan range is extremely large or your hardware is struggling.

That said, a tighter Region of Interest can improve load times and keep your project folder cleaner, especially if you’re working with multiple scan areas or collaborating with others.

If you prefer a leaner project folder or faster loading times, you can reduce the number of files by tightening your import area:
Import your scans into Origins as usual.

  1. Use the point cloud export tool to select a focused Region of Interest.
  2. Export just that area as a new point cloud.
  3. Re-import the reduced file into a new PointCab project.

This keeps your file count – and disk space – under control while preserving all the data you actually need.

Final Thoughts

When a single scan suddenly turns into hundreds of files, it’s not Origins misbehaving – it’s Origins doing the hard work of organizing your data so you can actually use it.

If you’re ever unsure what’s going on behind the scenes, or want help optimizing your workflow, our support team is always happy to help. And if you want to better understand structured vs. unstructured data, check out our webinar on the topic.

Want to keep up with the latest pointCab news?

Then follow us on Social Media or subcribe to our newsletter!

From Monument to Point Cloud: How a Historic Building Becomes a 3D Model (Part 1)

blank

USER STORY

From Monument to Point Cloud: How a Historic Building Becomes a 3D Model (Part 1)

From Heritage Building to Digital Model – A Government Commission with High Standards

As part of a long-term digitization project, the state building authority commissioned the Janka engineering office to carry out a 3D survey of a historic courthouse. The project began with the documentation of the complex roof truss. The goal was to use the data for structural calculations as well as for the step-by-step creation of a BIM-ready building model.

Particular attention was paid to the precise capture of the existing building structure and a structured processing of the point cloud.

293 Scans, Three Floors, One Goal: Precision in a Heritage-Protected Roof Structure

The roof truss of the courthouse—comprising three full floors and an attic—was captured using a stationary Faro Focus X 130 laser scanner. A total of 293 stations were recorded across three levels, distributed among the west, central, and east wings. The special feature: The roof truss consists of several levels with walkways, making the scan complex and time-consuming.

“This is a rather special roof truss because it’s essentially three stories high. That makes it more complicated—you just need more stations.”

The scans were carried out without pre-registration; the processing was done entirely in the office.

From Raw Scan to Structured Model – How Origins & Scantra Can Tame the Data Chaos

After the scans were completed, the point clouds were first imported into PointCab Origins. There, the data was initially structured into clusters—an essential step in preparing for registration. The data was then exported to Scantra for scan registration. The clusters created in Origins were automatically transferred.

“The interface between Origins and Scantra works great. We process everything, reimport it into Origins, and do the final alignment there.”

Afterward, the registered scans were loaded back into Origins, where the final coordinate system was defined.

Control & Accuracy: Quality Over Speed

The verification of the processed point cloud is also done in Origins. Here, sections are created, and the point cloud is checked for duplicates, misalignments, or missing scans.

“Quality control is a fixed part of our workflow before the data goes into the drawings.”

Regarding accuracy, the Janka engineering office adheres to accuracy level 3 according to Eckstein—with a tolerance range of ±2 cm. Thanks to laser scanning and precise evaluation with Origins, this standard is not only met, but often exceeded.

“In 3D, we’re usually under 1 cm—which suits our requirements perfectly.”

Hidden Damage in Sight: Visible and Plannable with the Delta Module

A widely used feature in numerous other projects at Janka Engineering is the Delta Module. It allows for quick and visual deformation analysis not only of floors but also of facades and historic walls.

“For us, the Delta Module is extremely important. You can immediately see: Aha, the facade leans outward or inward. That’s invaluable, especially for heritage projects or cemetery walls.”

The module is used to identify critical components or deformations even before modeling. This allows early assessment of potential issues during future insulation or renovation efforts.

Essential for Daily Operations: Origins at Engineering OFFICE Janka

Since 2014, the Janka engineering office has been working with PointCab Origins. Over the years, the software has evolved into the central platform for all scan-to-BIM processes within the company. While one or two licenses used to suffice, today every draftsman works with their own license. The workflows have been optimized over time—thanks in large part to the continuous development of the software.

“We’re now at seven licenses—and every single one is in constant use because there’s always something to extract.”

Origins is used not only for visualization but also for sharing plans, coordinates, and as an interface to programs like Archicad and BricsCAD.

COMING UP NEXT:

In Part 2 of the user story with the Janka engineering office, the focus shifts to the following topics:

  • CAD Integration
  • 3D Viewer
  • New Perspectives with Nebula
  • Outlook: New Features & Upcoming Projects

Want to keep up with the latest pointCab news?

Then follow us on Social Media or subcribe to our newsletter!

From Monument to Point Cloud: How a Historic Building Becomes a 3D Model (Part 2)

blank

USER STORY

From Monument to Point Cloud: How a Historic Building Becomes a 3D Model (Part 2)

From Point to Drawing: How the Scan Comes to Life in the CAD Model

After the point cloud had been cleaned, aligned, and verified in PointCab Origins, Janka Engineering moved on to modeling the roof structure in Archicad and BricsCAD. Although the PointCab plugins weren’t yet used in this particular project, the team followed a well-structured workflow: they extracted precise sections and points from Origins, then manually modeled beams, trusses, and walls in CAD – always guided by panoramic views and the geometric accuracy of the point cloud.

Even twisted or non-orthogonal timber members were modeled with care, thanks to the exact coordinate picking tools in Origins.

“You can only draw what you can trust, so our models start with reliable sections from PointCab.”

Accuracy in Focus: From Standards to Sub-Centimeter Precision

blank

Though the process was manual, the results were impressively precise. While Janka generally works to a ±2 cm tolerance common in historic documentation, this project often achieved sub-centimeter accuracy, especially in horizontal sections exported at a 5 mm resolution from Origins.

The final 3D model wasn’t just for documentation – it could be used directly by structural engineers. Thanks to its clean geometry, it was imported into statics software where beams were recognized as real elements for snow load analysis and simulation. The ability to go from scan to simulation without relying on 2D interpretation made this workflow especially powerful.

Plugins in Use: A Smoother Workflow for Future Projects

Although the modeling for this particular project was completed without plugins, Janka Engineering has since integrated the PointCab plugins for Archicad and BricsCAD into their workflow – with great success.

“In the past, we created the model without a plugin. With the plugins, the modeling work is significantly easier. That’s great.”

Mr. Janka emphasizes that the plugins have made the workflow more efficient, especially when it comes to precisely transferring points for beams, rafters, and other components directly from the point cloud. What was once a manual process is now supported by smart automation, saving time and reducing the margin for error.

“Just Click, No Install”: Why Intuitive Viewers Are in High Demand

Testversion, Punktwolken Software, Punktwolken-Viewer

Despite all the enthusiasm, Mr. Janka expressed one specific criticism in the interview: the current viewer solution at that time, PointCab Share, was too technical for many clients. Especially in public or heritage projects, there’s often a multi-year gap between data capture and construction. What clients want is a tool they can use independently and long-term – without needing to log in, install anything, or worry about expiring cloud access.

Janka Engineering still uses Faro’s older Webshare-to-go solution for this reason: a browser-based viewer that runs locally.

Exploring Nebula: A Viewer That Closes the Gap?

While not a direct replacement for a fully offline viewer, PointCab Nebula addresses many modern sharing challenges. It enables project viewing directly in the browser—without needing to install software – and offers more hosting flexibility than typical cloud platforms. Data can be shared via local servers, private clouds (e.g., Nextcloud), or third-party services like Google Drive.

Nebula offers:

  • Simple, browser-based navigation through panoramic views
  • Sharing of sub-projects, sections, and views via link
  • Flexible hosting options (local or external)
  • Full compatibility with Origins projects

“I’d definitely take a look at it […] maybe it’s exactly the kind of development we’re looking for.”

Nebula is, therefore, definitely a step toward more client-friendly sharing and a signal that PointCab is listening and evolving in the right direction.

Conclusion: Best Practice with a Clear Perspective for Improvement

blank

Just like in Part 1, this second part underscores how PointCab Origins supports both technical accuracy and practical usability, while also showing there’s still room to grow.

The user story of Engineering Office Janka clearly shows how PointCab Origins functions as a central hub in the scan-to-BIM workflow – from capture to structuring and validation to CAD evaluation. At the same time, it also reveals areas with potential for improvement. This blend of praise and constructive criticism is what makes the project so valuable, not only for other users but also for the ongoing development of the software itself.

“I think the first thing that gets opened in our office—right after the digital time clock—is Origins. It runs all day long.”

Want to keep up with the latest pointCab news?

Then follow us on Social Media or subcribe to our newsletter!

How Accurate Is My Laser Scanner Really? – A Practical Evaluation Using Point Cloud Software

blank

How Accurate Is My Laser Scanner Really?

A Practical Evaluation Using Point Cloud Software

As part of a student project at HTW Dresden, Jannes, a student of Geomatics, set out to answer a key question: How accurate is the Lixel L2 Pro mobile laser scanner from XGRIDS really? Together with Laserscanning Europe, he developed a comprehensive testing setup to evaluate the absolute geometric accuracy of the scanner in both indoor and outdoor environments. The tools PointCab Origins and CloudCompare played a central role in analysis, visualization, and validation.

Objective:
Reliable Accuracy Through Comparison and Validation

The project investigated:

  • Indoor and outdoor precision of the L2 Pro
  • Comparison with a FARO Focus as a reference device
  • Influence of control points (GCPs) on accuracy
  • Point cloud comparison using CloudCompare
  • Distance and section analyses with PointCab Origins

The main question:
Does the scanner meet the ±3 cm accuracy claimed by the manufacturer – and under what conditions?

Indoor Test:
Controlled Conditions for Clear Results

In a hall at HTW Dresden, the L2 Pro was tested first without, then with, four control points. Faro checkerboard targets with known 3D coordinates were used to calculate spatial distances.

Results:

  • Without control points: Ø 9.2 mm deviation
  • With control points: Ø 5.3 mm deviation
  • Accuracy improvement through GCPs: ≈ 4 mm

Vertical accuracy – often problematic with mobile scanners – was also analyzed. In contrast to the smaller K1, the L2 Pro showed no significant vertical deviations, even in critical zones.

blank

Analysis with PointCab Origins:
More Than Just Visualization

point cloud software, punktwolken software

For evaluation, Jannes used PointCab Origins – especially for:

In several sections at 5 mm resolution, barely any deviations were found between the L2 Pro cloud and the FARO reference. Only at highly reflective surfaces (e.g., ventilation ducts), deviations of up to 2.9 cm appeared – still within specification.

Sebastian Zell, managing director of a Berlin-based specialist in architectural surveying, also underlines the importance of PointCab Origins for quality assurance:

“We use PointCab Origins to reliably and visually verify whether our point clouds are correctly registered – especially on large-scale projects.”

PointCab Origins proved invaluable in this project too: the software enables users to identify deviations at a glance – a key advantage for safe handover to CAD or BIM.

Watch the related video (GERMAN):
👉 Die perfekte Registrierung – Interview 1/3 | Punktwolken Software, Zielmarken, 3D-Laserscanner

Outdoor Test:
Accuracy in Real-World Conditions

blank

A 600 m loop was scanned using the L2 Pro to evaluate how the distribution of GCPs (Ground Control Points – permanently surveyed points in the field) affected results:

  • Scenario 1: GCP spacing < 100 m
    → RMSE horizontal: 2.6 cm | vertical: 0.4 cm
  • Scenario 2: GCP spacing > 100 m
    → RMSE horizontal: 3.2 cm | vertical: 1.2–1.5 cm
  • Scenario 3: Poorly distributed GCPs
    → RMSE vertical: up to 14 cm

Conclusion: a strategic and dense placement of GCPs is essential for overall accuracy – especially for mobile scanners using SLAM technology.

CloudCompare: Making the Numbers Visible

blank

CloudCompare was also used alongside PointCab Origins to:

  • Directly compare point clouds (Cloud-to-Cloud Distance)
  • Visualize deviations using color mapping
  • Distinguish differences in mm and cm ranges

Result: The L2 Pro point cloud stayed well below the 3 cm tolerance across large areas, often under 1.5 cm – confirming its suitability for precise as-built documentation.

Conclusion:
Quality Requires Verification – And the Right Tools

blank

The project clearly shows: modern scanners like the L2 Pro can produce highly accurate results with the right workflow. But it’s only through tools like PointCab Origins and CloudCompare that the true reliability of the data becomes clear and measurable.

PointCab Origins offers:

  • Visual validation via intuitive section views
  • Direct distance and elevation comparisons
  • Confidence before CAD or BIM handover

If you aim for precision, you must not only capture your data – but verify it.

Want to keep up with the latest pointCab news?

Then follow us on Social Media or subcribe to our newsletter!

Origins 4.2 R16

PointCab Origins 4.2 R16

Origins 4.2 R16 – More Control, Fewer Clicks

PointCab Origins 4.2 R16

The new Origins 4.2R16 update brings practical improvements
that noticeably simplify everyday point cloud workflows.

EXTENDED DATA FORMATS - IMPORT/EXPORT

Import XGRIDS Panos – for a Structured Overview

What it’s for?

If you’re working with externally generated panoramic data, importing XGRIDS Panos is now easier than ever.

How it’s done:

Just go to “Tools > Import Elements > Import XGRIDS” and select the panoramicPoses.csv. Origins will read the data and create matching panoramas.

Bonus: A handy slider lets you skip images during import – for example, every second or third – which saves space and keeps things tidy.

Option to copy the images into project -> images will be copied under the PointCab Project Structure for easy sharing

Active by default: The option to copy images to the project. This integrates the images into the PointCab project, which is ideal when sharing the project with others.

Perfect for large datasets or multi-location projects.

NEW FUNCTIONS

Modeling Notes in Panos – visual, linked, efficient

What it’s for?

Modeling notes can now be displayed directly inside panoramas – no detours needed.

How it’s done:

Under “Tools > Import Points of Interest”, simply select the folder containing your prepared images with modeling notes. Origins automatically matches the images to the correct scans (as long as the filenames match the scan names). Any images that couldn’t be matched will show up under “Issues.”

There’s also an option to rename all note texts being added:
Under “POI Element Name,” enter a name to apply it to all texts. Leave it blank, and Origins will use the name of the image subfolder instead.

After importing, each text note – along with a clickable image link – will appear in the corresponding scan. The link can be opened directly in the Job Editor, so the matching image is just one click away. Plus, the images can optionally be copied into the project folder for easier sharing.

Ideal for those working with comments, review feedback, or detailed modeling guidance.

Clean Up with Structure: Delete Elements by Type

What it’s for?

The longer a project runs, the more clutter builds up – old measurements, outdated sections, irrelevant objects.

How it’s done:

With a simple fix:
Under “Tools > Delete Elements,” just select the type of elements you want to remove and delete them all at once. No more tedious clicking through.

One click – and the project is clean and organized again.

GENERAL IMPROVEMENTS

Chapel Ensmad– Efficient Surveying of a Historic Building

blank

What’s It About?

blank

Daniel Bayha, a master’s student in Structural Engineering at the Stuttgart University of Applied Sciences, developed a digital workflow for his thesis to precisely document the historic Ensmad Chapel. His approach covered everything from the wooden barrel vault construction to the entire building condition – inside, outside, and within the roof space.

A key focus was not just the structural assessment of the timber construction, but also the creation of highly accurate deformation-based plans—a task that would have been nearly impossible with conventional manual measurement methods. To achieve this, modern laser scanning technologies were combined with specialized software solutions like PointCab Origins.

The Subject – Ensmad Chapel

Ensmad Chapel is a true cultural landmark and has been a pilgrimage site for centuries. Originally built in the Gothic style, it underwent a significant Baroque transformation around 1660 and has been lovingly maintained over the centuries, with the most recent renovation in the 1970s.

Today, the chapel shows visible structural damage that needed to be analyzed. Daniel’s goal was to document the current state of the building and create accurate plans to serve as a basis for future restoration efforts.

Data Collection & Hardware

Daniel opted for the FlexScan 22 platform from Z+F as the hardware for data acquisition. The platform is equipped with the  IMAGER 5016 terrestrial laser scanner, which can be used both as a SLAM and as a static scanner. In addition, some details were measured manually to complement the data.

Scanning Duration: Approximately half a day on-site.

Challenges: Limited space, especially in the roof area. The FlexScan 22 had to be manually moved in this section, as it was not possible to walk through with a backpack scanner.

The combination of SLAM and terrestrial laser scanners brings together the best of both worlds:

SLAM scanners allow for quick and mobile real-time data capture – ideal for large or hard-to-reach areas.

Terrestrial laser scanners provide precise measurements and detailed imaging of key areas.

This approach enables the creation of an initial rough map using SLAM, which is then refined with the precise terrestrial scan data. The result? Time savings, increased efficiency, and a comprehensive and reliable data foundation tailored to the specific application.

However, in this case, certain details were additionally measured by hand.

Data Processing & Plan Creation

After data collection, erroneous points – such as those caused by passing individuals – were removed. This process took about a day and was conducted externally. The cleaned point cloud (in .E57 format) was then imported into PointCab Origins for further processing.
Using PointCab Origins, 2D sections (cross-sections, longitudinal sections, and top views) were generated from the 3D data. Daniel needed about a day to familiarize himself with the software, followed by approximately two days to create the sections.

With our YouTube tutorials and PDF guides on our website, Daniel was able to get started with Origins quickly and independently.

For those looking to become an Origins expert right away, we also offer a free demo session with our support specialists.

Data Export & Further Processing

The plans were exported as PDFs, which were then imported into Nemetschek Allplan. There, Daniel manually redrew the plans, achieving an accuracy of ±3 cm.


Alongside Allplan, Bluebeam Revu Extreme was also used for further PDF data processing.


Total Time Required: The final plan creation took about a week in total.

A faster workflow:
If Daniel had exported the plans directly as planar .dwg files – automatically aligned and scaled for Allplan – he could have skipped the PDF export step, saving significant time.

Good to know:
PointCab Origins is compatible with all major CAD programs and enables exports into their native formats. If you’re unsure about the best export option, our support team is always happy to help.

Conclusion & Key Takeaways

The Ensmad project impressively demonstrates how modern surveying technologies and specialized software solutions work together to digitally capture and prepare historic structures for restoration planning. Here are the key takeaways from the project:


1. Precision in Plan Creation:
By combining modern laser scanning technology with PointCab Origins, it was possible to generate an unlimited number of highly accurate plans that faithfully reflect the chapel’s deformations and details.

2. Time and Work Efficiency:
Despite some detours in the workflow, the project showed that complex surveying tasks can be completed efficiently with the right digital tools.


3. Optimization through Support:
If users encounter workflow obstacles, they should reach out to PointCab Support. Often, alternative export methods or workflow optimizations can be quickly implemented together.

Project Participants

This project was conducted by Daniel Bayha as part of his master’s thesis, “Surveying and Restoration of the Wooden Barrel Vault in Ensmad Chapel”.
University: Stuttgart University of Applied Sciences
Program: Structural Engineering
Academic Supervisor (HFT): Prof. Dr.-Ing. Roland Fink
Project Supervisor (LAD): Sabine Kuban

Want to keep up with the latest pointCab news?

Then follow us on Social Media or subcribe to our newsletter!